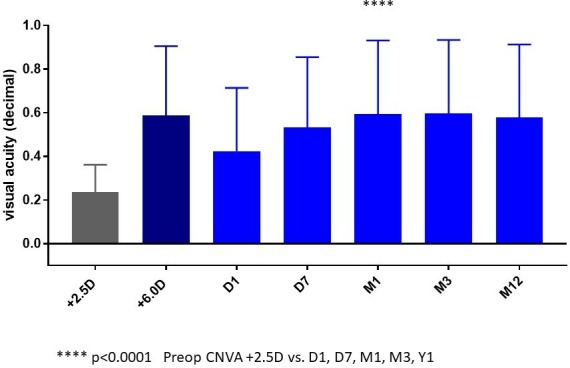
Figure 2.

Graph illustrating the preoperative corrected near visual acuity (grey bar) and the postoperative uncorrected near visual acuity at various time gates. CNVA, corrected near visual acuity (light blue bars). Dark blue bar shows the preoperative CNVA at 15 cm with +6.0 D addition (estimated vision)
