
Figure 3.
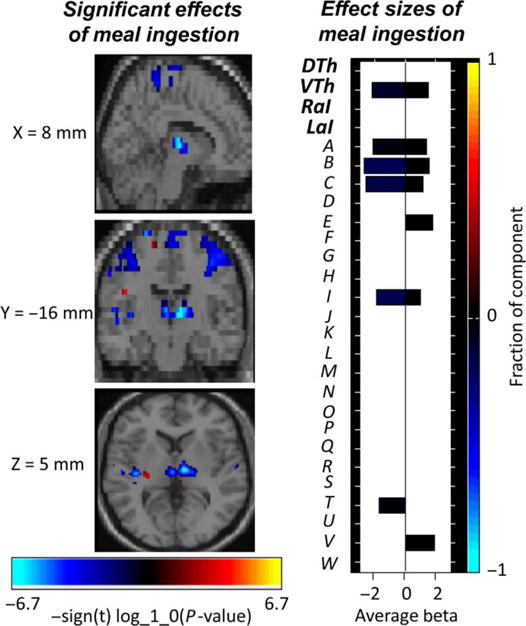
Composite image of the significant effects of meal ingestion on intra-network connectivity. The effect size for each component is shown to the right; primary networks of interest: dorsal thalamus (DTh), ventral thalamus (VTh), right anterior insula (RaI), left anterior insula (LaI); secondary networks of interest: bilateral secondary somatosensory cortex (A), right sensorimotor cortex (B), left sensorimotor cortex (C), bilateral subgenual anterior cingulate cortex (D), bilateral caudate (E), bilateral pallidum/putamen (F), bilateral hippocampus/parahippocampal gyrus/amygdala (G), bilateral anterior cingulate cortex/medial orbitofrontal cortex (H), bilateral paracentral lobule (I), bilateral primary somatosensory cortex (J), bilateral superior parietal (K), bilateral supramarginal (L), left temporoparietal junction (M), right superior/inferior parietal (N), bilateral ventrolateral prefrontal cortex (O), right left temporoparietal junction (P), bilateral medial cingulate cortex (Q), right inferior frontal operculum (R), bilateral precuneus (S), bilateral superior temporal (T), bilateral dorsal anterior cingulate cortex/medial cingulate cortex (U), bilateral medial prefrontal cortex (V), left dorsolateral prefrontal cortex (W)