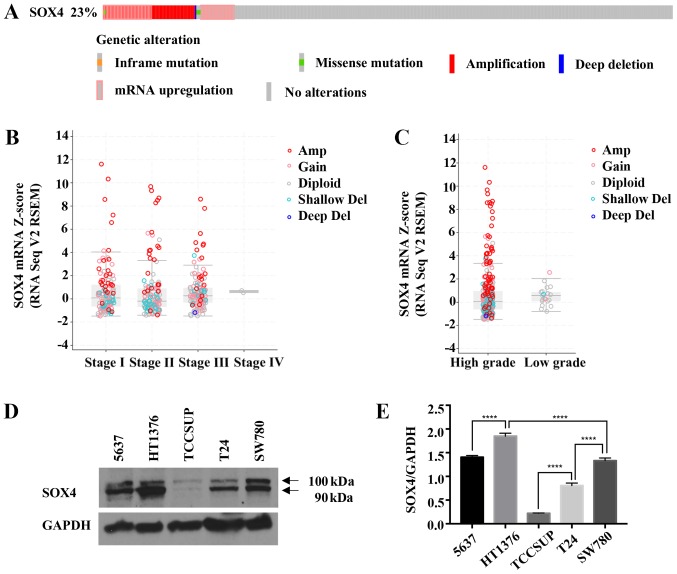
Figure 1.
Increased SOX4 expression in patients and in bladder cancer cell lines. (A) cBioPortal data from the Cell, 2017 dataset (6) showing copy number alterations and mRNA expression levels (+2.0) in 93 out of 404 (23%) patients. (B) SOX4 mRNA levels for different stages of BLCA in the TCGA dataset. Amplified samples are shown in red, and deletions are in blue, and diploid are in gray. (C) SOX4 mRNA levels for TCGA BLCA samples for low grade and high grade samples. Sample colors are the same as in (B and D). Western blot analysis of bladder cancer cell lines showing varying degrees of SOX4 protein expression. (E) Quantification of SOX4 protein levels. ****P<0.0001.

