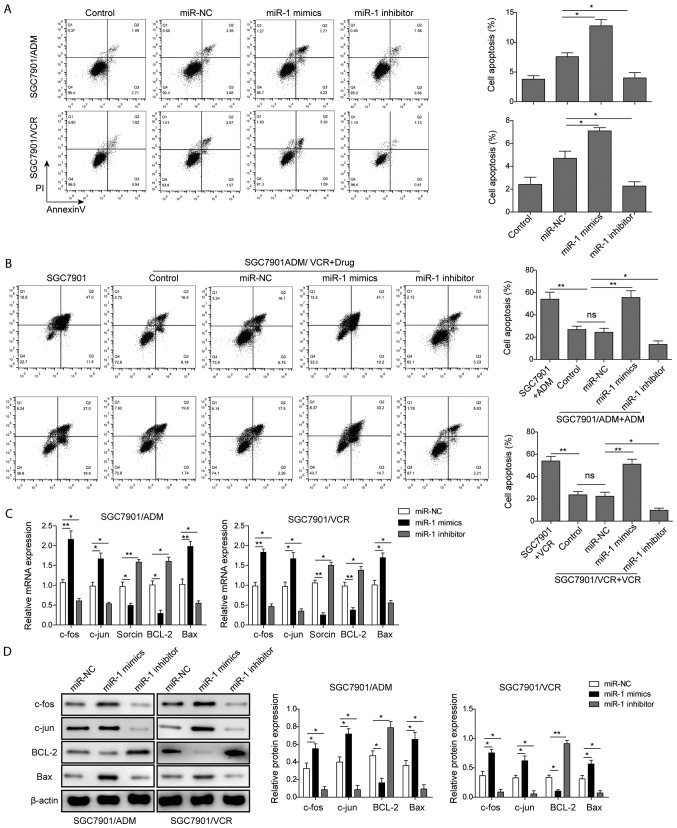
Figure 3.
miR-1 induced gastric cancer cell apoptosis. (A) The flow cytometric analysis of apoptosis rates of SGC7901/ADM and SGC7901/VCR with transfection of miR-NC, miR-1 mimics and miR-1 inhibitor. (B) The flow cytometric analysis of apoptosis rates of SGC7901/ADM and SGC7901/VCR cells with transfection of miR-NC, miR-1 mimics and miR-1 inhibitor followed by treatment with ADM and VCR, respectively. The (C) mRNA and (D) protein expression levels of c-fos, c-jun, sorcin, BCL-2 and Bax in SGC7901/ADM and SGC7901/VCR with transfection of miR-NC, miR-1 mimics and miR-1 inhibitor. Data are presented as the mean ± standard deviation of three repeated experiments. *P<0.05, **P<0.01. miR, microRNA; VCR, vincristine; ADM, adriamycin; miR-NC, scramble control; BCL-2, B cell lymphoma-2; Bax, Bcl-2-associated X protein.

