Figure 3.
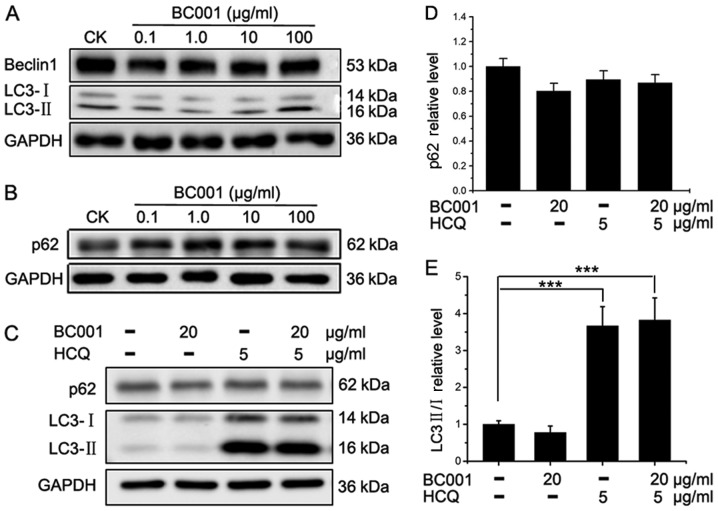
Effects of BC001 and/or HCQ on the expression of Beclin1, LC3 and p62. (A) The expression of Beclin1 and LC3 in BGC823 cells treated with BC001; (B) the expression of p62 in BGC823 cells treated with BC001. (C) The expression of p62 and LC3 in BGC823 cells treated with HCQ and/or BC001. (D) Relative expression levels of p62 in BGC823 cells treated with HCQ and/or BC001; (E) relative expression of LC3 II/I in BGC823 cells treated with HCQ and/or BC001. ***P<0.001 vs. CK. CK, control group; HCQ, hydroxychloroquine; LC3, microtubule-associated light chain 3.

