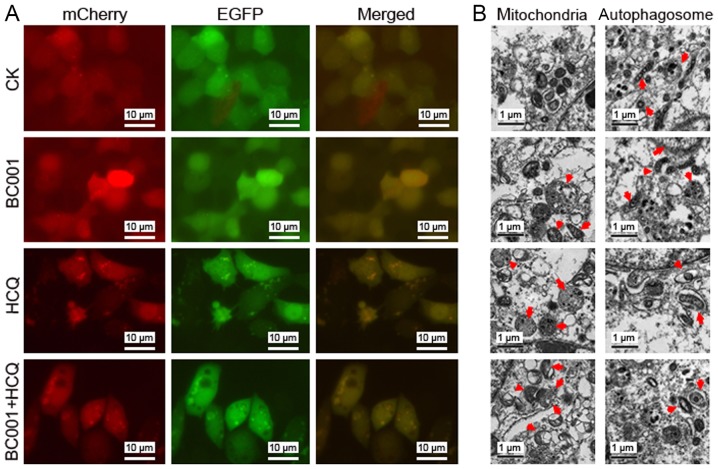
Figure 4.
Effects of BC001 and/or HCQ on autophagy. (A) An mCherry-EGFP-LC3 reporter was constructed to observe the stepwise progression of autophagy in BGC823 cells. Scale bar: 10 µm. (B) Alterations in mitochondria and autophagosomes present in the cytoplasm were observed by transmission electron microscopy. The red arrows represent mitochondria or autophagosomes. Scale bar: 1 µm. CK, control group; EGFP, enhanced green fluorescent protein; HCQ, hydroxychloroquine.

