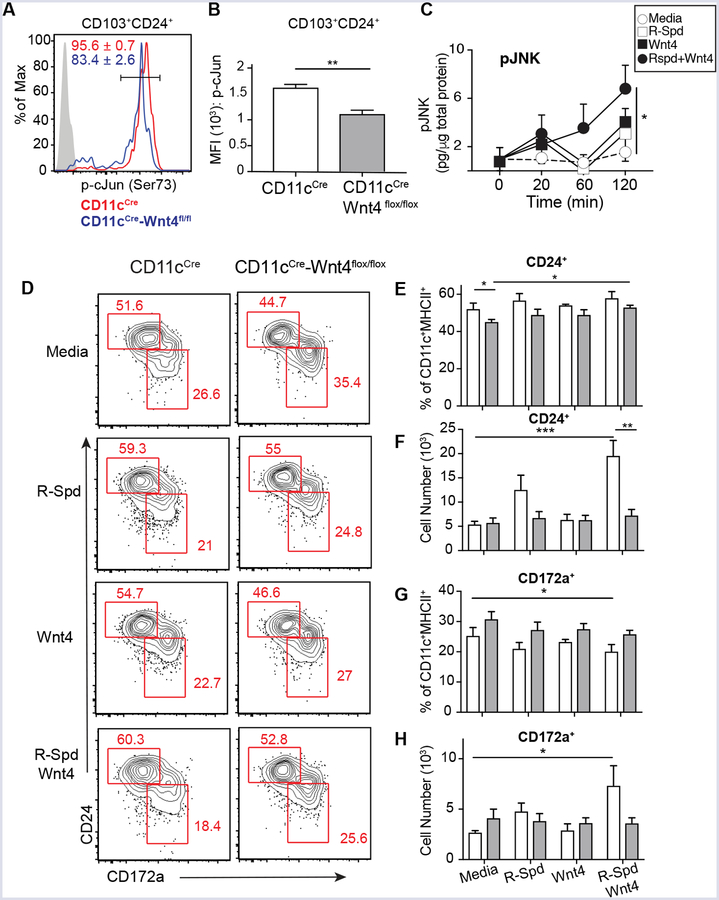
FIGURE 4.
Wnt4 regulates activation of cJun and JNK and Flt3L-induced BMDC differentiation. (A) Representative histogram showing levels of phosphorylated cJun in CD103+CD24+ cDC in Flt3L+GM-CSF culture as gated in Figure 3E. Numbers show frequencies (Mean ± SEM from 5 biological replicates) of p-cJunhigh cells. (B) Median fluorescence intensity (MFI) of p-cJun in CD103+CD24+ cDC from Flt3L+GM-CSF culture. (C) Quantification of pJNK at indicated time points from BM cells treated with IMDM complete media alone or media containing R-Spd, Wnt4, or R-Spd+ Wnt4. (D) Representative flow plots from BM culture of for 7 days in IMDM complete media + 100 ng/ml Flt3L supplemented with R-Spd1 (100 ng/ml), Wnt4 (100 ng/ml), R-Spd1+ Wnt4(100 ng/ml each), or vehicle. Cells were pre-gated on CD45+F4/80−B220−CD11c+MHCIIhigh population. (E-H) (E and G) Frequencies and (F and G) cell number of CD24+ (E, F) and CD172a+ (G, H) from conditions in “D”. Graphs show Mean ± SEM from N=3–5 biological replicates per condition with * p< 0.05, ** p< 0.01 and *** p< 0.005 as determined by t-test or two-way ANOVA with Tukey correction for multiple comparison. Representative results from 3 independent experiments.

