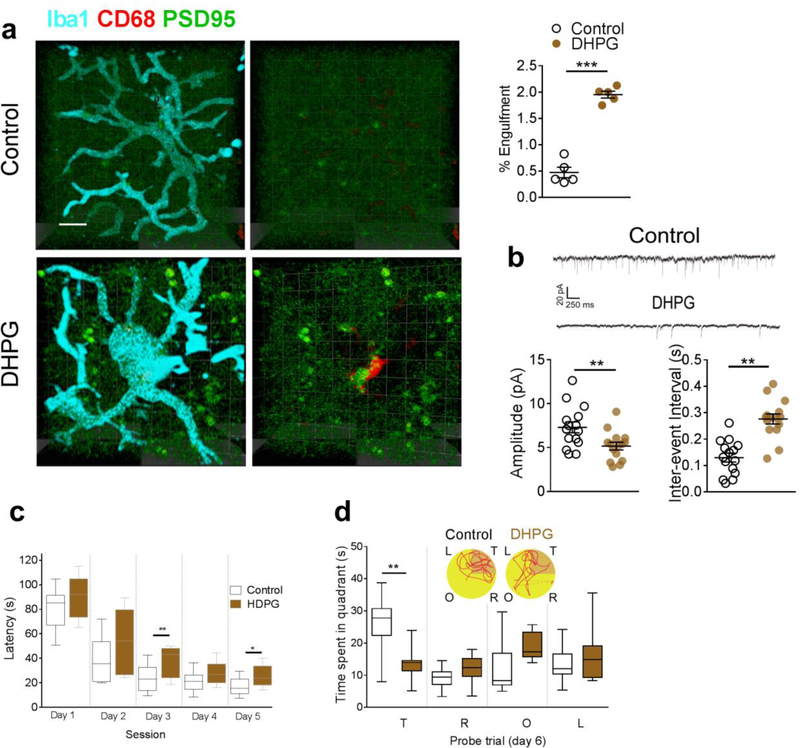
Figure 11. Activation of mGluR1 signaling by DHPG induced the microglial phagocytosis of glutamatergic synapses.
DHPG increased the internalization of PSD95 with the lysosome marker CD68 in microglia in the hippocampal CA1of naïve rats (a, n = 5 rats in each group, unpaired-t test, t = 12.4, DF = 8, two-tailed P <0.0001, scale bar = 10 μm). Each dot represents the mean value of 4 brain sections of one rat. DHPG also decreased the amplitude (b, n = 15 rats in each group, unpaired-t test, t = 2.8, DF = 28, two-tailed P = 0.0084) and increased inter-event interval (b, n = 15 rats in each group, unpaired-t test, t = 2.8, DF = 28, two-tailed P = 0.0084) of mEPSCs in hippocampal CA1 neurons, and increased escape latency (c, n = 10 rats in each group, effect of group [F1,18 = 8.2, P = 0.01], effect of time [F4,18 = 82.8, P<0.0001], interaction between group and time [P = 0.52]), and decreased the time in the target quadrant (d, n = 10 rats in each group, F1,18 = 14.4, P = 0.001). (d) Representative path tracings in each quadrant during the probe trial on day 6 (T, target quadrant; R, right quadrant; O, opposite quadrant; L, left quadrant). Data represent mean ± s.e.m. For box-and-whiskers plots, the box extends from the 25th to 75th percentiles, a line within the box marks the median. Whiskers (error bars) above and below the box represent the minimum and maximum values. *P<0.05, **P<0.01, ***P<0.001.

