Fig. 4.

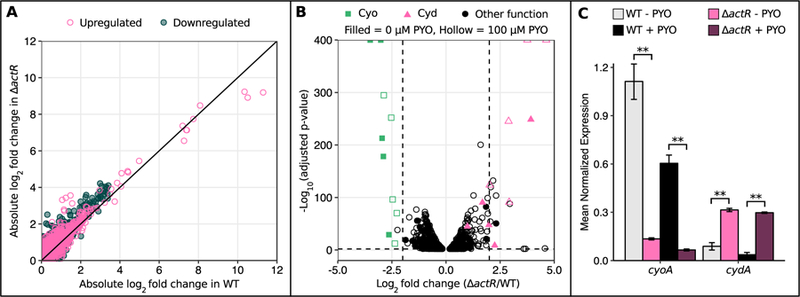
Expression of cytochrome o oxidase and cytochrome d oxidase is dysregulated in ∆actR.
A) Plot of the absolute values of log2 fold changes in gene expression upon 100 µM PYO treatment in WT against absolute values of log2 fold changes in gene expression upon 100 µM PYO treatment in ∆actR. Only genes that were statistically significantly differentially expressed (adjusted p-value < 0.01) upon PYO treatment in at least one strain are plotted. Each point represents a single gene. The black line is y = x. B) Volcano plots of RNA-seq data comparing gene expression levels in ∆actR to WT, with either 0 µM PYO or 100 µM PYO. The vertical dashed lines mark a log2 fold change of −2 or 2, and the horizontal dashed line marks an adjusted p-value of 0.01. Only genes with statistical significance below the adjusted p-value cutoff are plotted. C) qRT-PCR data confirming the expression patterns of the cyo and cyd operons in ∆actR vs. WT. The + PYO condition represents treatment with 100 µM PYO. Only cyoA and cydA are shown for brevity, as they are co-transcribed with other members of these operons. Expression levels were normalized to the housekeeping gene rpoD. ** p < 0.01 (Welch’s t-test followed by the Benjamini-Hochberg procedure for controlling the false discovery rate; n = 3). Error bars represent standard deviations of biological replicates.
