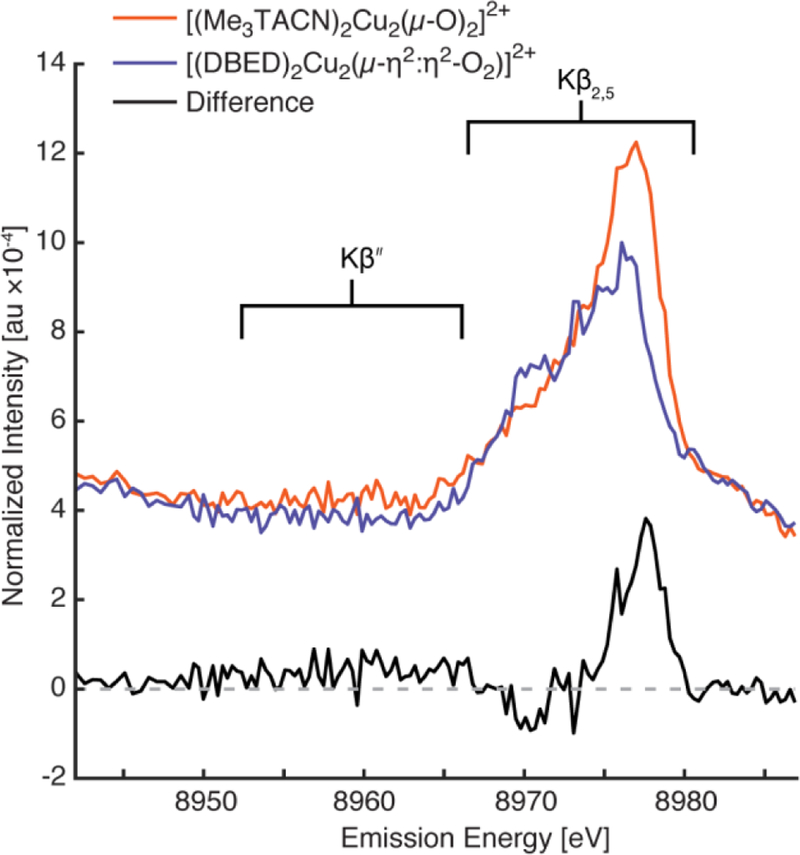
Figure 1.
VtC XES of [(Me3TACN)2Cu2(µ-O)2]2+ (red) and [(DBED)2Cu2(µ-η2:η2-O2)]2+ (blue). Both VtC XES intensities are normalized to the Kβ mainline energy (not shown) integrated area of 1. The difference of the two spectra ([(Me3TACN)2Cu2(µ-O)2]2+ – [(DBED)2Cu2(µ-η2:η2-O2)]2+) is exhibited below (black) with a dashed horizontal guideline at zero intensity. [(DBED)2Cu2(µ-η2:η2-O2)]2+ exhibits a unique shoulder at the low energy side of its Kβ2,5 peak (~8970 eV) that appears as a negative peak in the difference spectrum. A broad Kβ’’ feature for [(Me3TACN)2Cu2(µ-O)2]2+ is observed centered at ~8961 eV that also appears as a broad positive peak in the difference spectrum.

