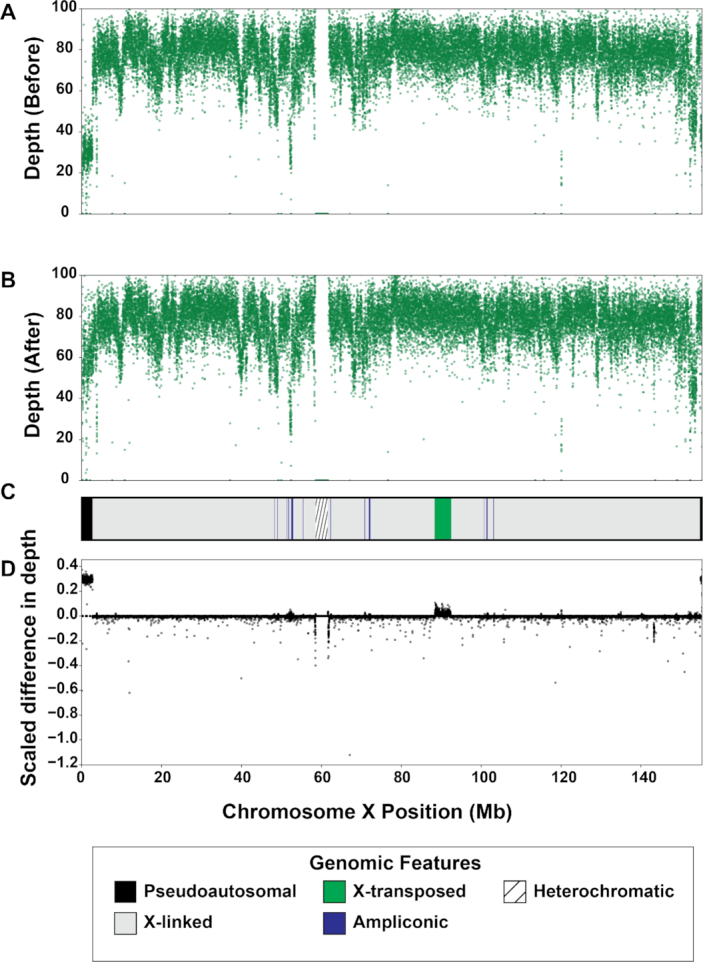
Figure 1:

Sequencing depth on chromosome X before and after XYalign. Mean sequencing depth for the Dataset 1 XX individual in 5-kb windows across the X chromosome before (A) and after (B) XYalign processing. Changes in depth (D) are presented as the sign of the difference times the absolute value of the log10 difference, where the difference is depth after XYalign minus depth before XYalign. The chromosome map (C) presents the location of X chromosome genomic features depicted in the legend. X chromosome coordinates are identical in all plots.
