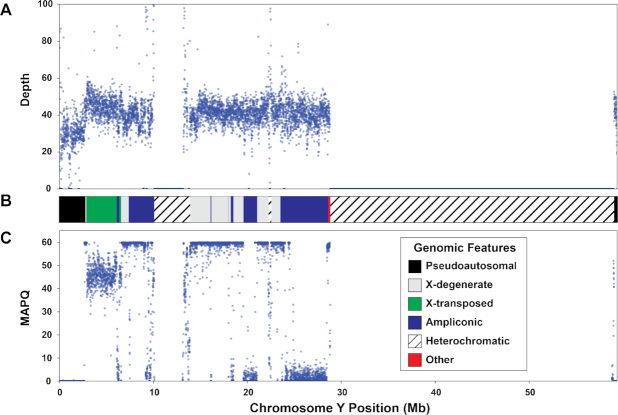
Figure 3:
Y chromosome sequencing depth and quality. Mean sequencing depth (A) and mapping quality (MAPQ; C) for the Dataset 1 XY individual in 5-kb windows across the Y chromosome. The chromosome map (B) presents the location of Y chromosome genomic features depicted in the legend. Y chromosome coordinates are identical in all plots.

