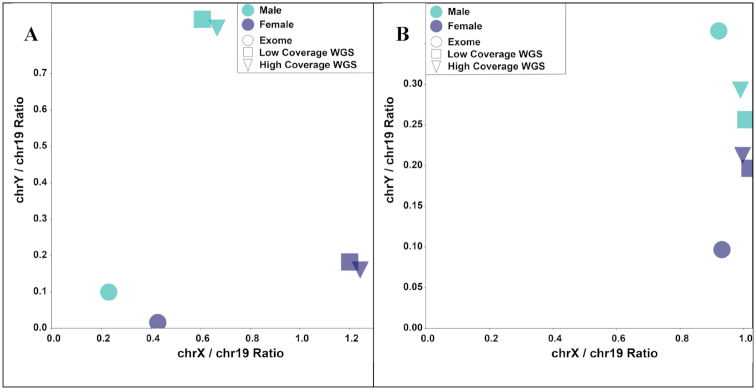
Figure 5:
Relative sequencing depth and mapping quality on the X and Y chromosomes across different sequencing strategies. Values of relative (A) sequencing depth and (B) mapping quality come from exome (circles), low-coverage whole-genome sequencing (WGS; squares), and high-coverage WGS (triangles) for a single male (green) and female (blue) individual. Mean depth and MAPQ on chromosome 19 was used to normalize the sex chromosomes.

