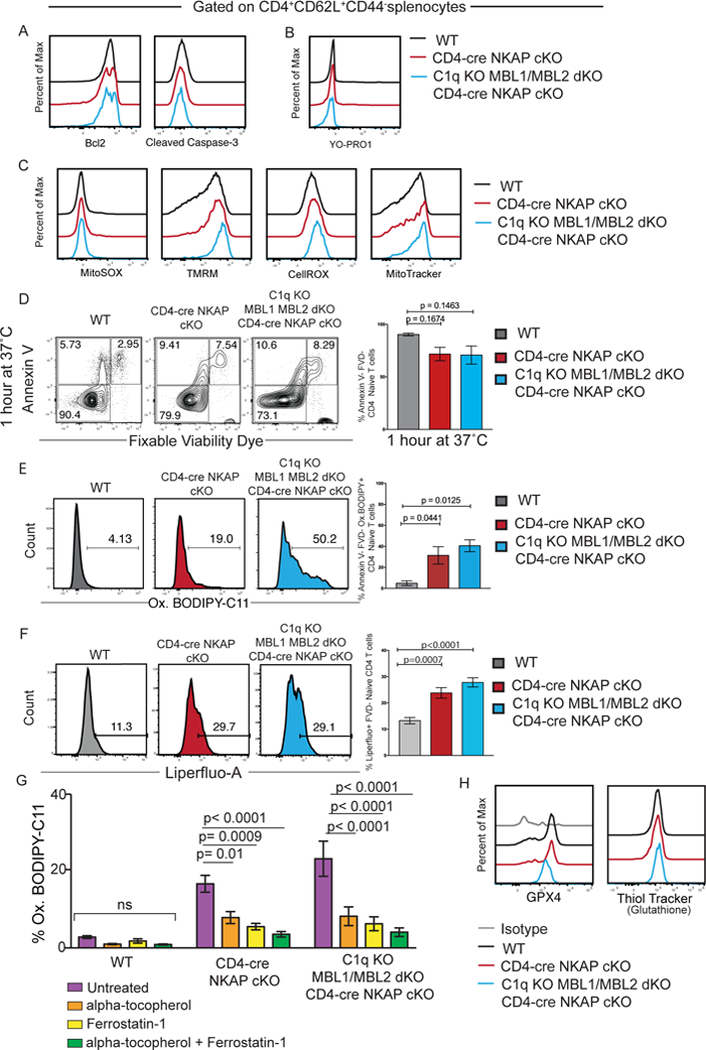
Figure 5. NKAP-deficient naïve T cells have increased lipid peroxidation.

(A) Bcl2 and Cleaved Caspase-3 expression. (B) Levels of YO-PRO1. (C) Levels of MitoSOX, TMRM, CellROX, and MitoTracker. (D) Examination of frequencies of Annexin-V−FVD− (live), Annexin-V+FVD− (dying), and Annexin-V+FVD+ (dead) CD4+CD62L+CD44− splenocytes from WT, CD4-cre NKAP cKO, and C1q KO MBL1 MBL2 dKO CD4-cre NKAP cKO mice after 1 hour in culture. (E) Frequencies of oxidized BODIPY C-11 (Ox.BODIPY) CD4+CD62L+CD44−Annexin-V−FVD− splenocytes (non-apoptotic and non-necrotic naïve T cells) after 1 hour in culture. (F) Frequencies of Liperfluo positive CD4+CD62L+CD44− splenocytes after 30 minutes in culture. (G) Frequencies of oxidized BODIPY C-11 (Ox.BODIPY) CD4+CD62L+CD44−FVD− splenocytes treated without and with ferroptosis inhibitors alpha-tocopherol (Vitamin E), Ferrostatin-1 and a combination of alpha-tocopherol and Ferrostatin-1. (H) GXP4 expression and levels of glutathione. Flow cytometry plots are representative of at least 3 independent experiments with at least 3 mice. Bar graphs show the mean of 3 independent experiments with at least 3 mice per group in total. P-values were calculated by one-way ANOVA with multiple comparisons. Error bars represent SEM.
