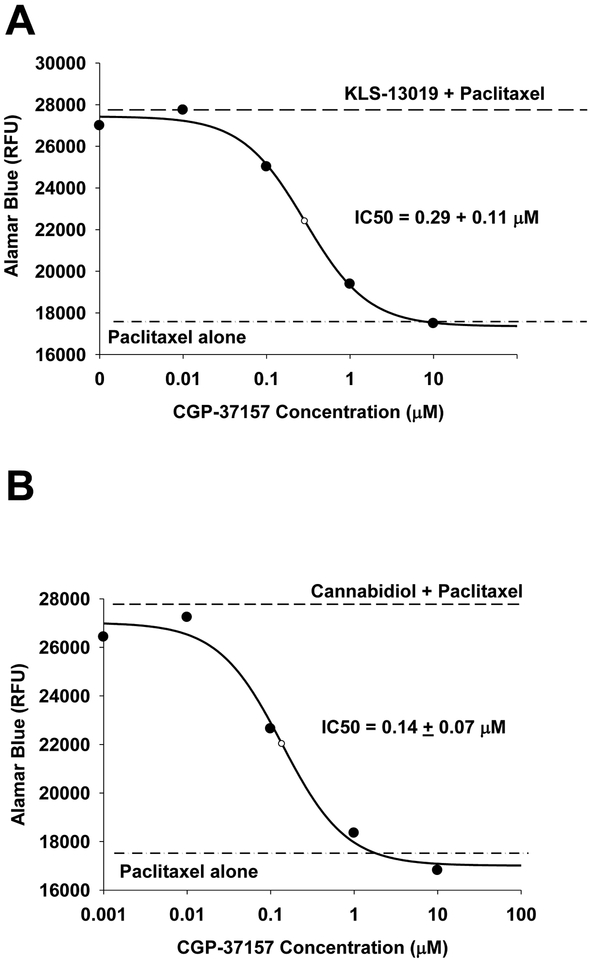
Fig. 3.
The IC50 for CGP-37157 (a mNCX-1 inhibitor) is compared for 100 nM KLS-13019 (part A) and 10 μM cannabidiol (part B) in dorsal root ganglion cultures treated for 5 hours on day 9 in culture. The IC50 ± the standard error were determined from a curve fitting procedure by a 4-parameter logistic analysis. Each value is the mean of 5 determinations at each concentration. The standard errors for the data points ranged from 4–7% of the mean. A representative experiment from two replicate experiments is shown. The dashed line represents the Alamar Blue fluorescence value for cultures treated with the respective test agent and 3 μM paclitaxel, with the control value being at zero CGP-37157 concentration. The dash-dot-dash line is the fluorescence response of cultures treated only with 3 μM paclitaxel.

