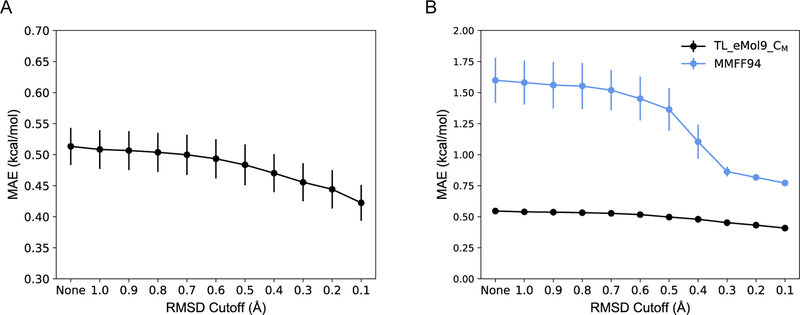
Figure 4.
(A) Absolute MAE and (B) relative MAE on test sets with different RMSD cutoffs. “None” means the performance is for total test set, “value” means the performance is for subset, which only includes conformations with RMSD less than “value”. Average and standard deviation of performances from five models trained with random split data have been shown. Performances of TL_eMol9_CM, MMFF94 are colored as black and blue, respectively.

