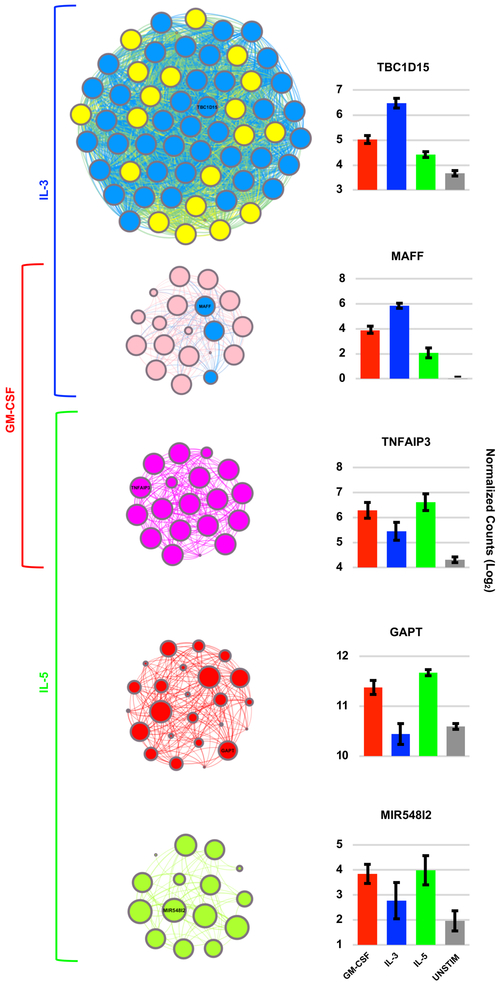
Figure 3. Hub genes of the yellow WGCNA module include a large number of differentially expressed IL-3 specific genes.
Gene connectivity plots of the five significant WGCNA modules along with the mean gene expression for the most representative (“hub”) gene of each module. Top 10% of genes from each module are shown. Large nodes indicate “hub genes” of increased connectivity. Blue nodes represent genes that were group-specific based on DESeq2 analysis. For example, in the yellow module nodes that are depicted in blue rather than yellow represent IL-3 specific genes based on DESeq2 analysis. In this particular module, there were a large number of IL-3 specific differentially expressed genes amongst the WGCNA hub genes. Error bars indicate standard error of the mean.

