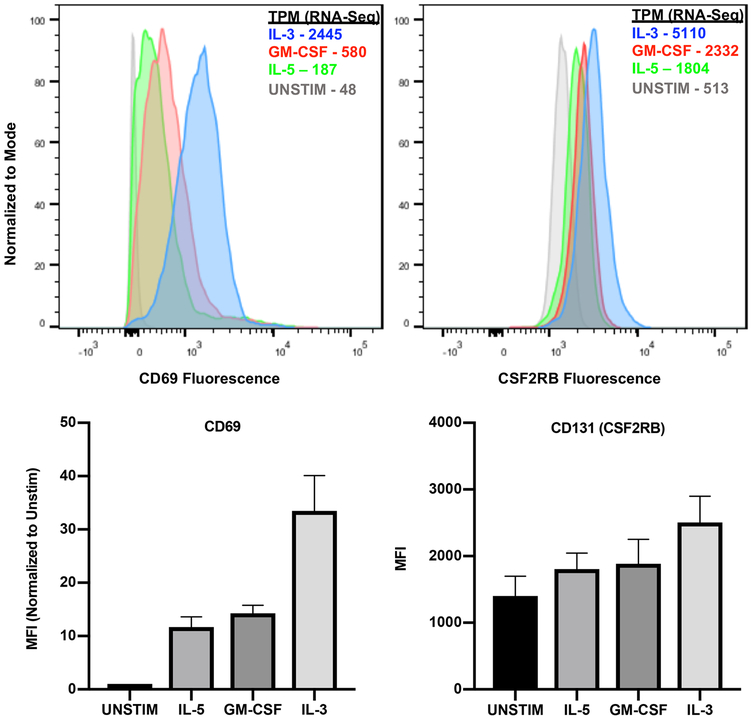
Figure 5. Protein levels of CD69 and CD131 in human eosinophils.
Fluorescence-activated cell sorting (FACS) of surface CD69 and total cell CD131 (CSF2RB) with mean fluorescence intensity (MFI) for each cytokine-stimulated condition. Both met statistical significance by one-way ANOVA (p < 0.05). Corresponding sequencing data for each gene is included in transcripts per million (TPM).

