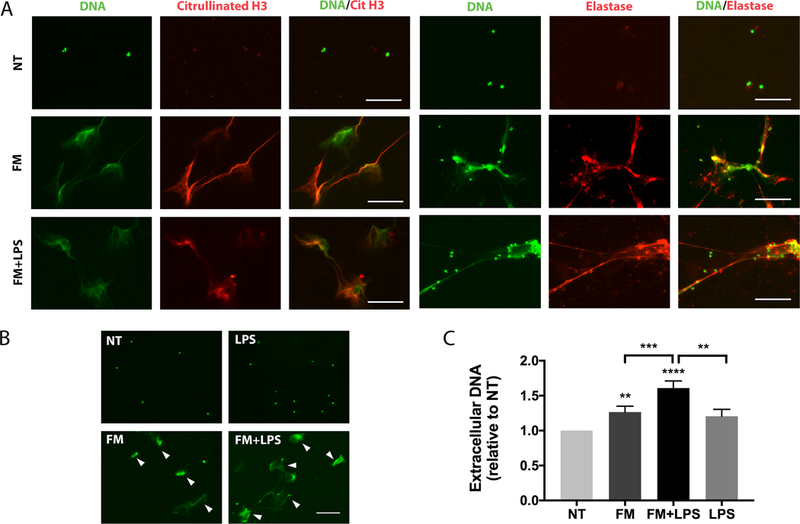
Figure 3. Neutrophils release NETs in response to FM-CM.

Neutrophils were exposed to no treatment (NT); unstimulated FM-CM (FM); LPS-stimulated FM-CM (FM+LPS); or LPS alone, after which: (A) Extracellular DNA (green) of released NETs colocalized with citrullinated histone 3 (red) or neutrophil elastase (red). Images are representative of three independent experiments. Scale bar= 100μm. (B) NETs were visualized using Sytox Green (arrowed). Images are representative of five independent experiments. (C) Extracellular DNA was quantified using PicoGreen (n=13). *p<0.05, **p<0.01, ***p<0.001 compared to NT unless otherwise indicated.
