
Figure 3:
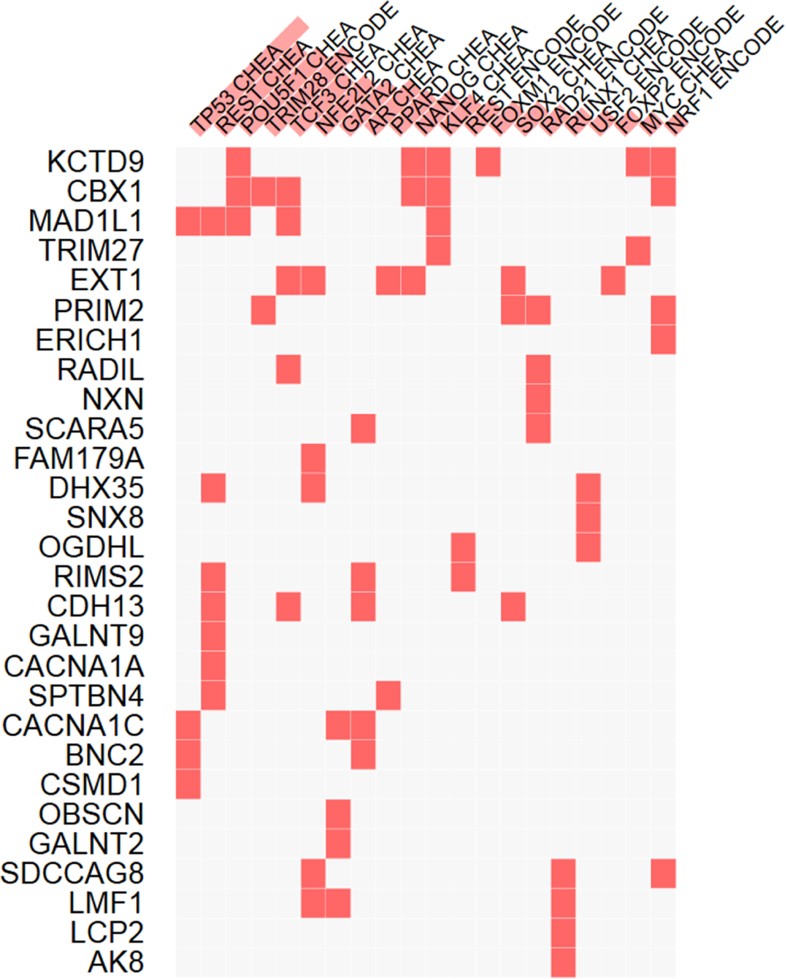
The results of enrichment analysis using Enrichr are shown here, where for each transcription factor, e.g., REST, its (here ENCODE mapped) targets among genes identified in our study are indicated by red squares (and include in this case RIMS2, CDH13, SPTBN4 etc.). Note that statistical significance of the enrichment is indicated by red vertical bars associated with each transcription factor.