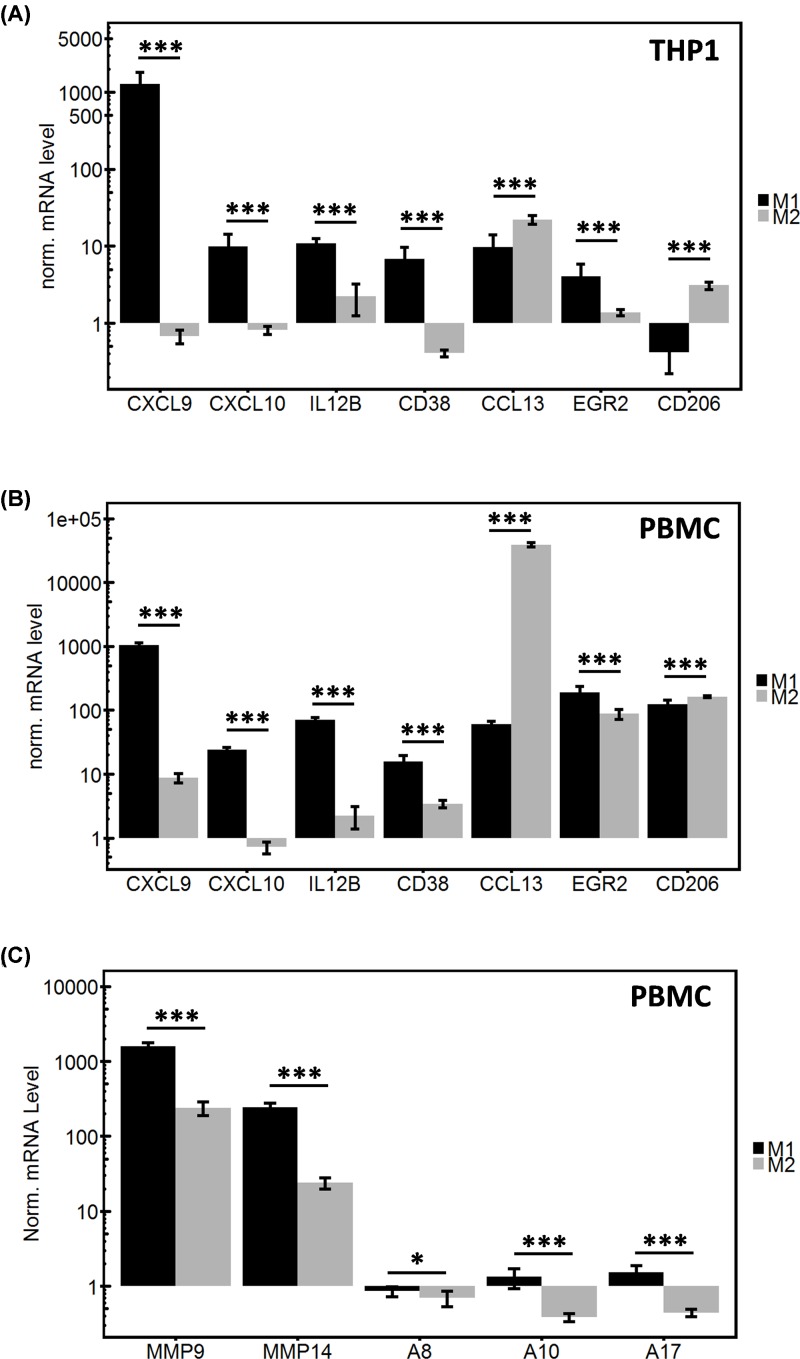
Figure 1. Quantitative PCR analysis of macrophage polarization markers.
THP1 cells were similarly polarized in either M1-like or M2-like phenotype by adding specific factors (IFNγ for M1 and IL-4 for M2). In both cases polarization was analyzed by qPCR for markers associated with a specific phenotype. qPCR was performed in triplicates and results were normalized to the reference gene (XS13) and additionally to the parental M0 cells, results are shown on a logarithmic scale. All comparisons between M1-like and M2-like cells for each specific marker were highly significant for THP1 cells (A) CXCL9: P = 0.0001375; CXCL10: P = 0.000265; IL12B: P = 0.0007499; CD38: P = 0.0001981; CCL13: P = 5.571e−06; EGR2: P = 0.002148; CD206: P = 1.064e−10) as well as for PBMCs (B) CXCL9: P = 3.257e−09; CXCL10: P = 1.517e−09; IL12B: P = 1.207e−09; CD38: P = 1.094e−05; CCL13: P = 2.588e−10; EGR2: P = 0.0001212; CD206: P = 0.0001489). The differences in protease expression between M1- and M2-like PBMC were significant in all cases (C) MMP9: P = 2.144e−08; MMP14: P = 2.962e−08; ADAM8: P = 0.04464; ADAM10: P = 8.289e−05; ADAM17: P = 2.509e−05).

