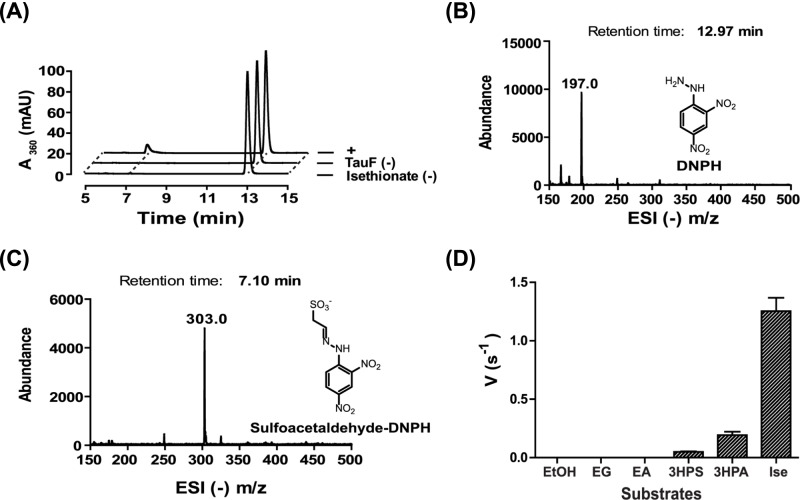
Figure 3. LC-MS assay to detect sulfoacetaldehyde formation and spectroscopic assay to demonstrate substrate specificity.
(A) The elution profile of the LC-MS assays monitoring absorbance at 360 nm. (B) The ESI (−) m/z spectrum of the DNPH peak in A). (C) The ESI (−) m/z spectrum of the sulfoacetaldehyde-DNPH peak in (A)). (D) Spectroscopic assays monitoring absorbance at 340 nm using various alcohol substrates including EtOH, EG, EA, 3-hydroxypropane-1-sulfonate (3HPS), 3HPA and isethionate (Ise).

