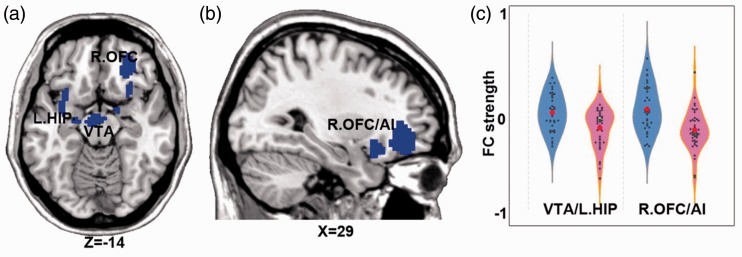
Figure 2.
Brain regions showing significant group differences on the right NAFC network. Note: p < 0.005, 3dClustSim correction. (a) the decreased right NAFC in VTA and left HIP; (b) the decreased right NAFC in right OFC and AI; (c) the quantitative display of group difference of right NAFC network; Blue color indicates PDM < HC. The color bar presents with the z scores. The blue violin represents HC group, while pink violin represents PDM group. OFC: orbital frontal cortex; VTA: ventral tegmental area; HIP: hippocampus; AI: anterior insula; NAFC: nucleus accumbens functional connectivity.

