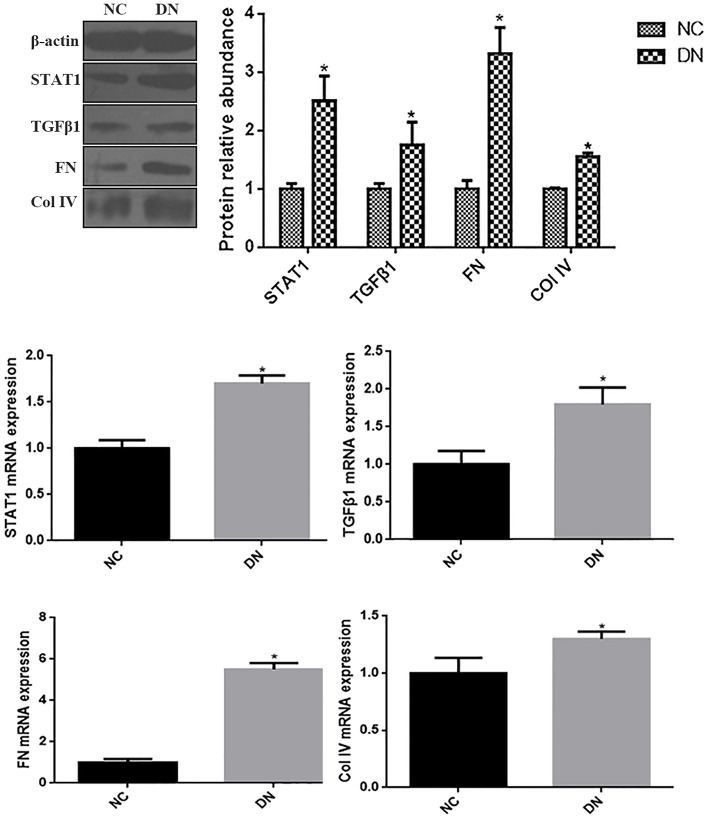
Figure 1.
The expressions of STAT1, TGFβ1, FN, and Col IV in non-diabetic adjacent normal kidney tissues (NC), and renal biopsy sections from DN patients. (A) Protein expression levels of STAT1, TGFβ1, FN, and Col IV were quantified by western blot analysis. (B) mRNA expressions levels of STAT1, TGFβ1, FN, and Col IV were quantified by qRT-PCR. *P < 0.05 vs. NC.

