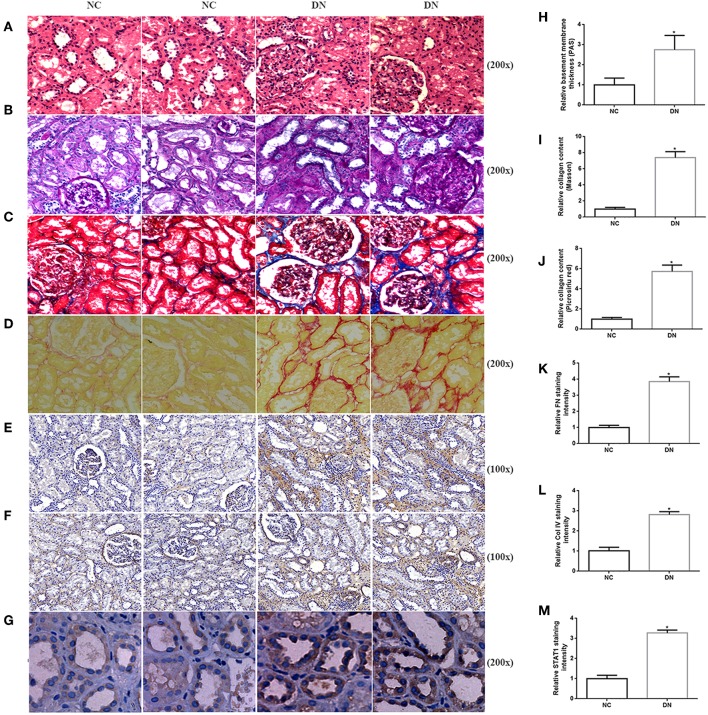
Figure 2.
Histopathological examination of non-diabetic adjacent normal kidney tissues (NC) and renal biopsy sections from DN patients. Representative images of (A) HE staining, (B) PAS staining, (C) Picrosirius red staining, and (D) Masson's trichrome staining for assessing TIF. Immunohistochemistry staining of (E) FN, (F) Col IV, and (G) STAT1 in human kidney sections. Original magnification, 100–200x. Quantitative analysis of (H) PAS staining, (I) Picrosirius red staining, (J) Masson's trichrome staining, (K) relative FN staining intensity, (L) relative Col IV staining intensity, and (M) relative STAT1 staining intensity. All data are expressed as means ± SEM, n = 10 (*P < 0.05 vs. NC).

