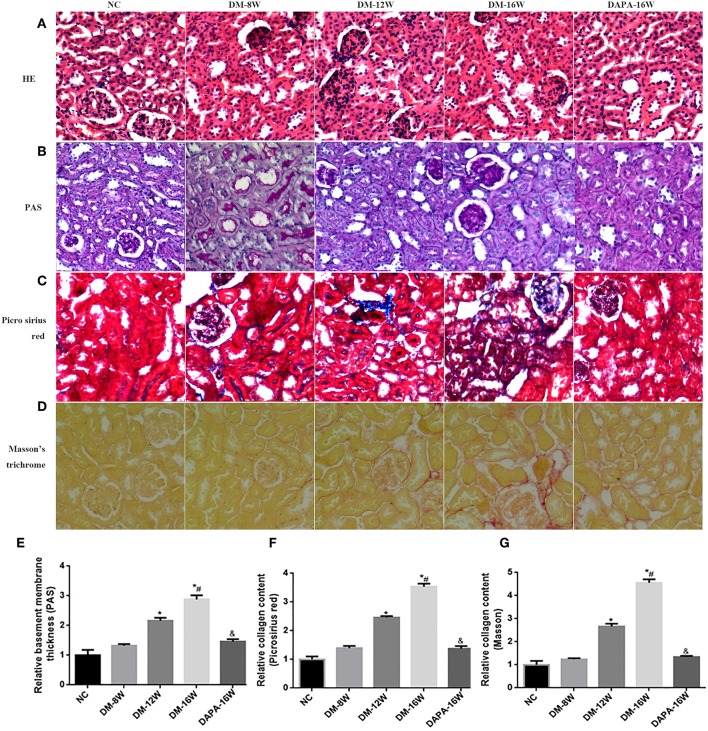
Figure 6.
Effect of DAPA on renal TIF. (A–D) Representative photomicrographs of H&E, PAS, Picrosirius red, and Masson's trichrome staining. (E–G) Quantification of PAS, Picrosirius red and Masson's trichrome staining. *P < 0.05 vs. NC; #P < 0.05 vs. DM-12W; &P < 0.05 vs. DM-16W. Values are mean ± SEM.

