Figure 4.
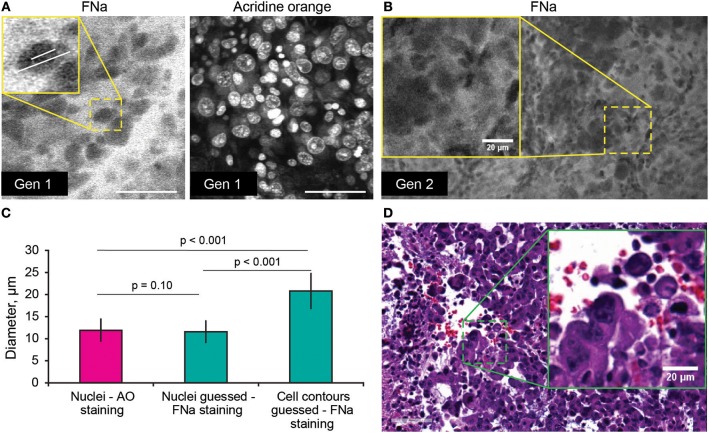
(A,B) Comparison of the tumor cellular features visible on confocal laser endomicroscopy images with fluorescein sodium (FNa) and acridine orange (AO). AO staining of the same specimen shows true nuclei size. Gradient of FNa distribution delineates cell contours with bright gray, while cell nuclei may be visible in some of the cells in a darker gray. (C) Comparison of the nuclei size measured on the images with AO staining to the nuclei size measured on the images with the FNa staining (n = 106 cells measured with AO stain; n = 53 nuclei and n = 52 cell diameters were measured with FNa stain). The average nucleus size determined on the FNa images was similar to the true average nucleus size based on the AO staining. Generation (Gen) 2 CLE image (B) shows anisocytosis, similar to (D) histologic findings. Scale bar in (A) is 50 μm. Used with permission from Barrow Neurological Institute, Phoenix, Arizona.

