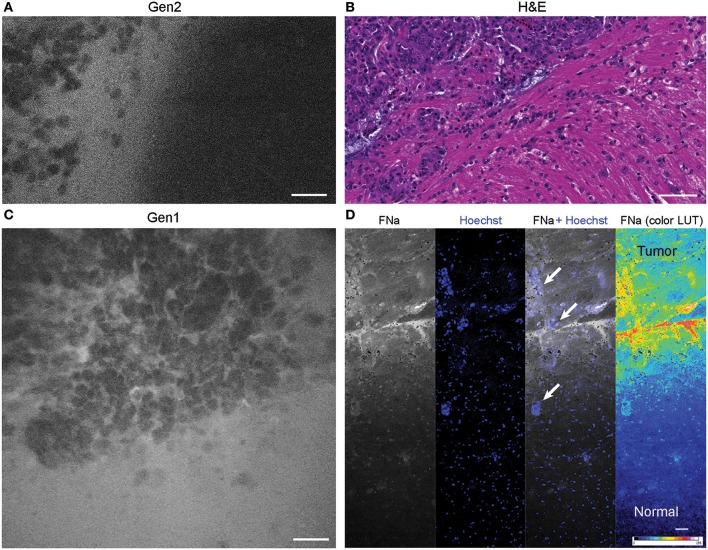
Figure 6.
Tumor border 1 h after intravenous fluorescein sodium (FNa) injection. (A) Generation 2 (Gen2) and (C) generation 1 (Gen1) confocal laser endomicroscopy images show a similar cellular architecture pattern of the GL261 glioma border region. (B) Hematoxylin and eosin (H&E) image of the tumor border from a matched sample. (D) Larger field of view ex vivo benchtop confocal image shows gradient of fluorescein diffusion from the tumor to the normal brain. Arrows indicate invading tumor cell groups. LUT, look-up table. Scale bars are 50 μm. Used with permission from Barrow Neurological Institute, Phoenix, Arizona.

