Figure 9.
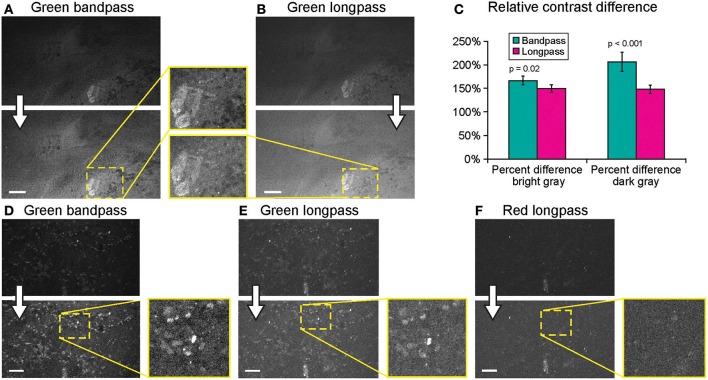
Generation 2 confocal laser endomicroscope (CLE) imaging with various filters. Comparison of the CLE images taken from the same regions of interest with green bandpass (A,D), green longpass (B,E), and red (F) optical filters. Human glioma samples (patients were injected with FNa intraoperatively) were used for analysis and illustration. Thick arrows signify post-processing in FIJI, which includes despeckling and maximum brightness adjustment. (C) Matching regions of interest (ROI) were selected in FIJI to compare contrast between various structures in longpass and bandpass filters. ROIs were manually drawn over the brightest structures (n = 5), over the surrounding gray background (n = 3), and on the dark round structures (n = 5). Paired Student t-tests were used for comparison. (D–F) Green bandpass (D), green longpass (E), and red longpass (F) filter images obtained at the same location. Scale bars are 50 μm. Used with permission from Barrow Neurological Institute, Phoenix, Arizona.

