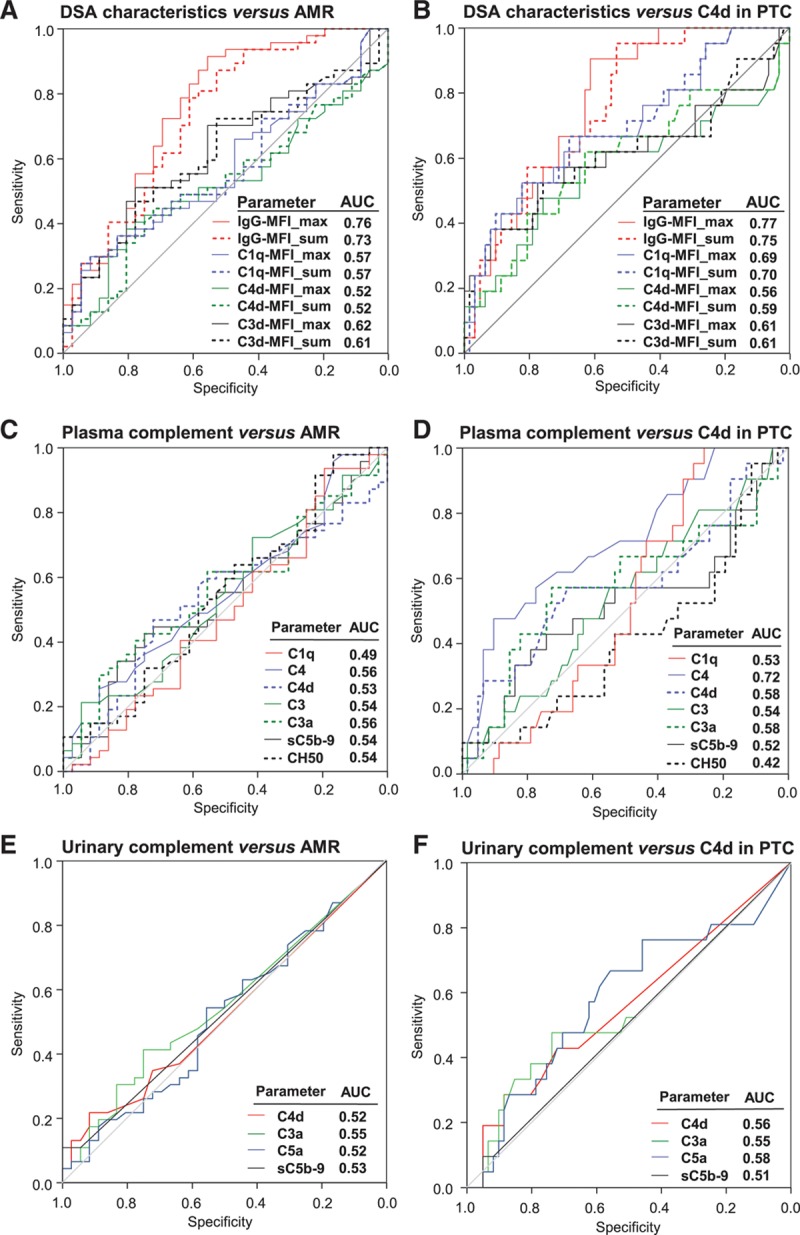
FIGURE 2.

Prediction of biopsy results by DSA characteristics and complement markers. ROC curve analysis of DSA characteristics (A,B), CH50 and complement markers in peripheral blood (C,D), or creatinine-adjusted complement products in urine (E,F) was performed in comparison with the finding of biopsy-confirmed AMR (A,C,E) or C4d staining in PTC, respectively (B,D,F). Panels show ROC curves and corresponding AUC values for each comparison. AMR, antibody-mediated rejection; AUC, area under the curve; CH50, 50% hemolytic complement activity; DSA, donor-specific antibody; MFI, mean fluorescence intensity; PTC, peritubular capillaries; ROC, receiver operating characteristic.
