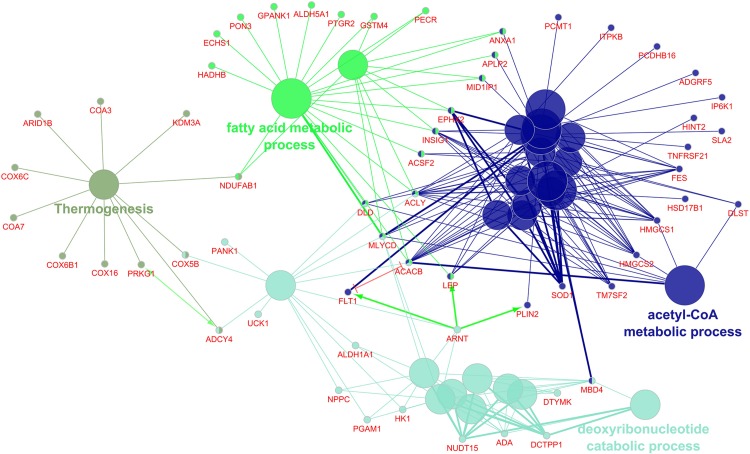
FIGURE 3.
Enriched ClueGO gene network from the epicardial adipose tissue. Similar gene ontology or KEGG pathway terms are clustered by color and the representative term for those clusters are presented. Gene names shown in red; Green lines with arrows represent gene activation interactions; Red lines with bars represent interactions involved in gene repression.

