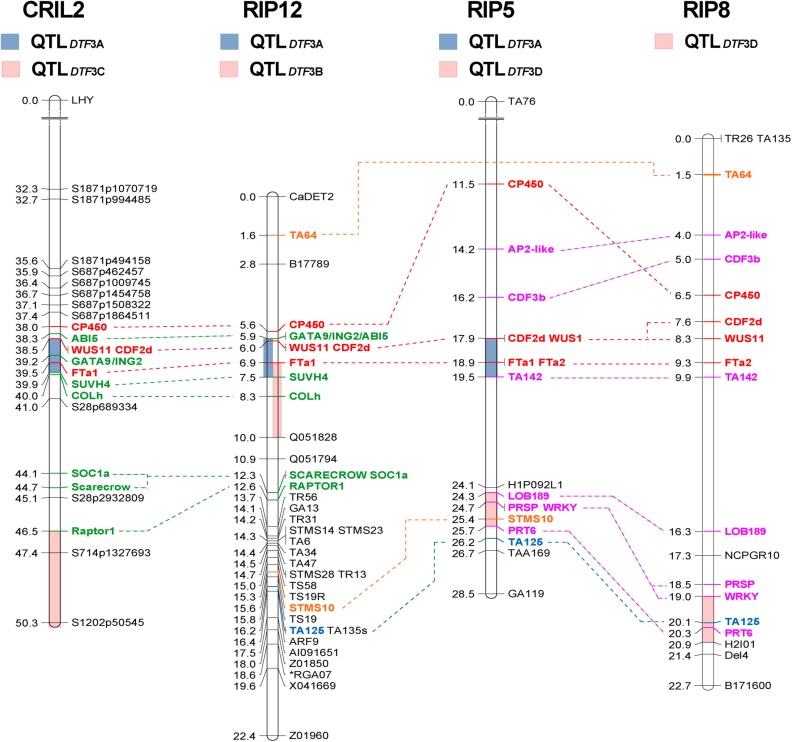
FIGURE 1.
Comparative mapping of flowering time QTLs on chromosome 3. Four regions of chromosome 3 (3A to 3D, colored bars) were found to influence flowering time across three different populations. The length of the bars representing each QTL indicates the two-LOD support interval, which corresponds to a ∼95% confidence interval (Van Ooijen, 2006). Only region 3A, in the central portion of the chromosome and containing a cluster of FT genes, is consistently detected in both narrow and wide crosses. Numbers at the left of the bars represent genetic distance (in cM). Common markers were used to compare the relative position of the QTLs across populations. Markers common to all populations are shown in red, to three populations in blue and to two populations in orange. Those common to both interspecific populations are shown in green, and to both intraspecific populations, in pink.

