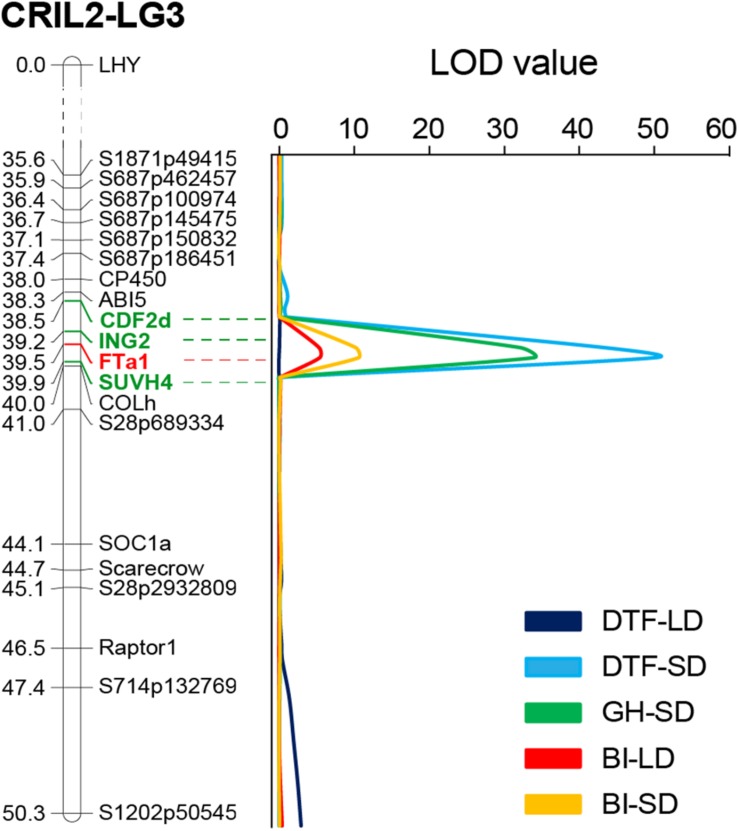
FIGURE 4.
The DTF3A region is also associated with growth habit and shoot branching. Portion of the Linkage Group three from the CRIL2 genetic map showing the perfect co-location of QTLs obtained for flowering time (DTF), growth habit (GH), and branching index (BI) under short (SD) and long days (LD). Numbers at the left of the bar indicate genetic distance (in cM). Markers included in the 3A interval (95% interval confidence) are highlighted in green and the most strongly associated marker (FTa1) is shown in red.

