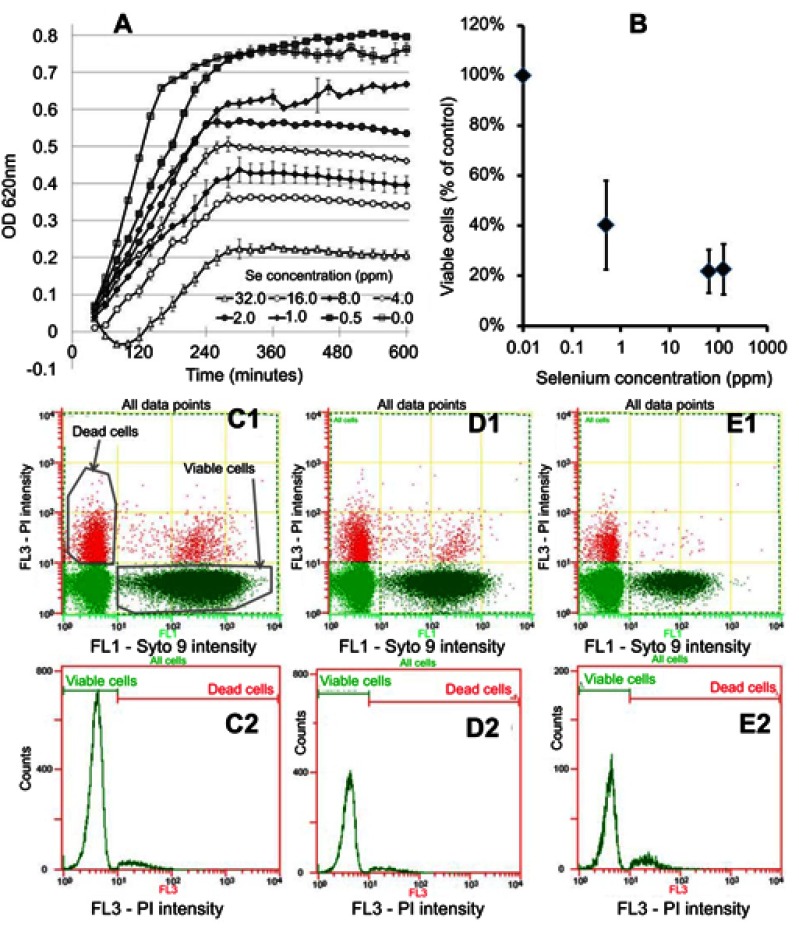
Figure 3.
In vitro testing results against MRSE. (A) OD growth curves of bacteria solutions treated with increasing amounts of Se NPs from 0.25 ppm to 256 ppm showing reduced growth when bacteria were treated with Se. (B) Live/dead assay results showing reduced live cell numbers when bacteria were treated with increasing concentrations of Se NPs. (C1, D1, and E1) Flow cytometry 2D dot plots of bacteria, treated with 0 ppm Se (ie, untreated), 0.5 ppm Se and 128 ppm Se and corresponding histograms (C2), (D2), and (E2).

