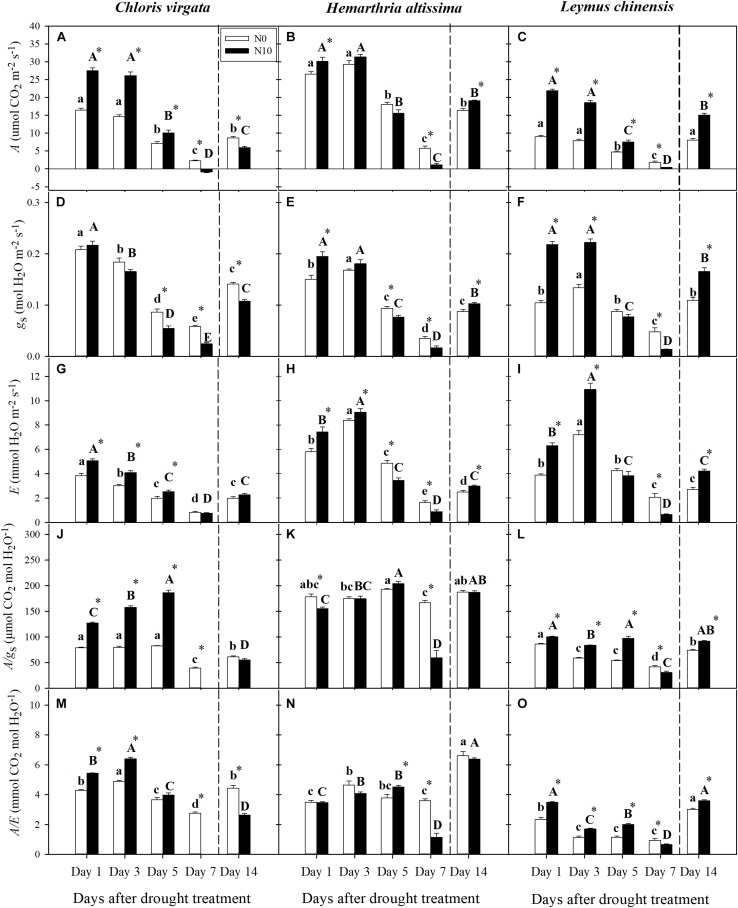
FIGURE 2.
(A–C) Leaf net CO2 assimilation rate (A; μmol CO2 m–2 s–1), (D–F) stomatal conductance (gs; mol H2O m–2 s–1), (G–I) transpiration rate (E; mmol H2O m–2 s–1), (J–L) intrinsic water-use efficiency (WUE) (A/gs; μmol CO2 mol H2O–1), and (M–O) instantaneous WUE (A/E; mmol CO2 mol H2O–1) on days 1, 3, 5, 7, and 14 of the drought/re-watering treatment in C. virgata (annual C4), H. altissima (perennial C4), and L. chinensis (perennial C3). Different lower-case letters and capital letters indicate significant differences among the measuring dates under the unfertilized (N0) treatment and the fertilized (N10) treatment, respectively. “*” represents significant differences between the N treatments (P < 0.05). Data are reported as the arithmetic mean ± 1 standard error (n = 6). Vertical dashed lines denote the separation of drought and re-watering period.

