Fig. 1.
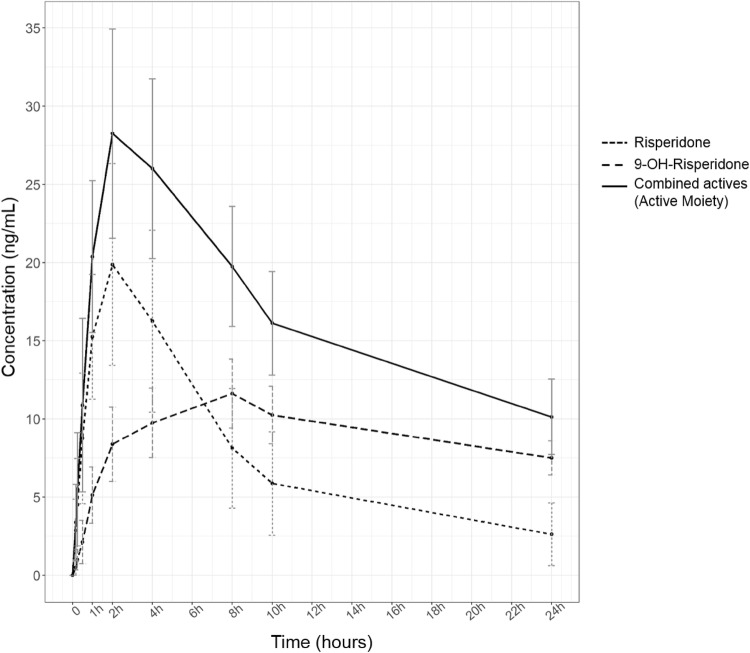
Mean concentrations in plasma plotted as time courses for risperidone (dotted line), its active metabolite 9-hydroxyrisperidone (dashed line) and the total active moiety (the sum of the concentrations of risperidone and 9-hydroxyrisperidone, solid line). Each error bar represents the standard error of the mean (SEM)

