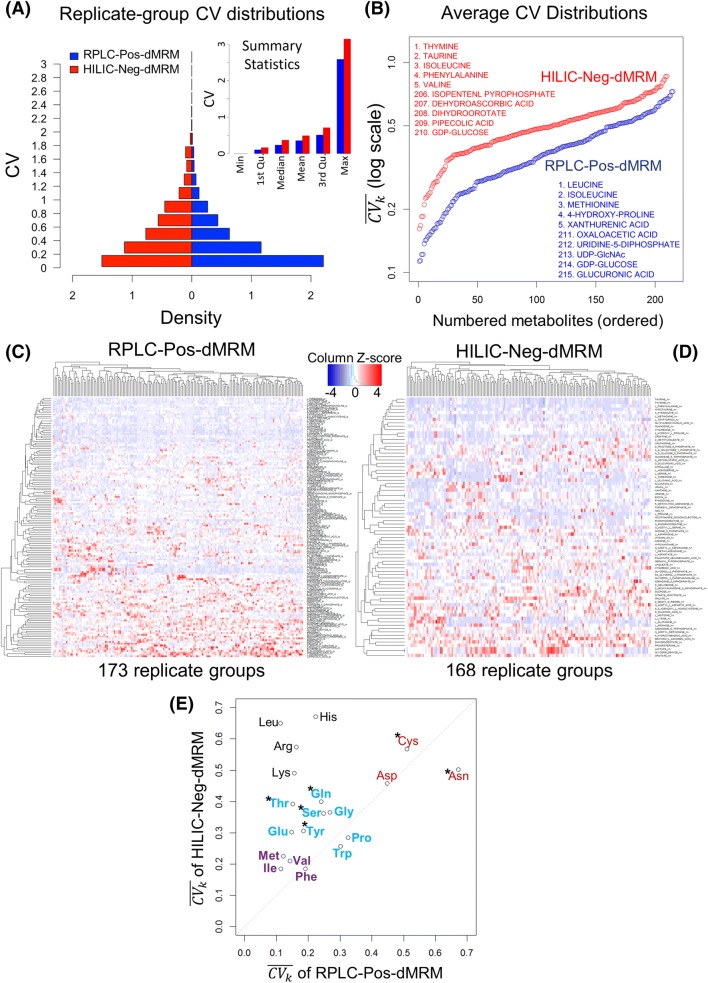
Fig. 3.
Replicate-group CV analysis. a Distributions of replicate-group CVs of the RPLC-Pos-dMRM and HILIC-Neg-dMRM methods. There are 28,765 CV values in RPLC-Pos-dMRM and 22,069 CV values in HILIC-Neg-dMRM from all 183 replicate groups for 220 and 228 metabolites, respectively. Summary statistics of all replicate-group CVs from the two methods are shown in the inset. b The ordered distributions of for individual metabolites from the RPLC-Pos-dMRM and HILIC-Neg-dMRM methods. The top 5 and bottom 5 metabolites at the two tails are listed from each method. c Heatmap and hierarchical clustering of replicate-group CVs for 145 metabolites with missing values less than 30% across all replicate groups in the RPLC-Pos-dMRM method. d Heatmap and hierarchical clustering of replicate-group CVs for 77 metabolites with missing values less than 30% across all replicate groups in the HILIC-Neg-dMRM method. CVs are standardized by the column Z-score in c, d. e A scatter plot of of 19 amino acids shows a reproducibility trend and patterns as color coded as a guidance for 3 groups. The 15 amino acids show lower or better reproducibility in RPLC-Pos-dMRM, while the 4 amino acids do so in HILIC-Neg-dMRM. The six polar amino acids are indicated by asterisks. See also Supplementary Table S3 for all values in b, e and the ordered lists of the 145 and 77 metabolites of c, d

