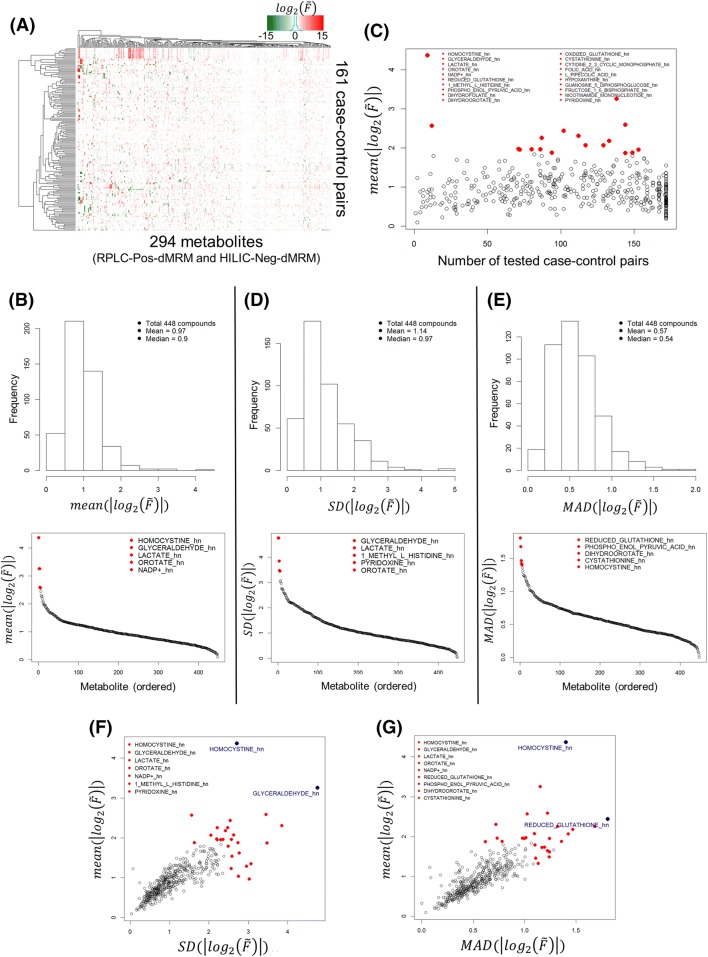
Fig. 5.
Abundance fold change analysis. a Heatmap of for 294 metabolites and 161 case–control sample pairs. b A histogram of all average fold-change magnitudes (; effect size) and an ordered distribution of the average magnitudes. The top 20 metabolites are listed. c A scatter plot of the average fold-change magnitudes and the numbers of tested case–control pairs. d Effect-size variability in terms of the standard deviation (SD). A histogram of SDs of the effect sizes and an ordered SD distribution. The top five metabolites are listed. e Effect-size variability in terms of the median absolute deviation (MAD). A histogram of MADs of the effect sizes and an ordered MAD distribution. The top five metabolites are listed. f A scatter plot of the average effect sizes and the SD variability. The union of the top five metabolites from b, d are listed. g A scatter plot of the average effect sizes and the MAD variability. The union of the top five metabolites from b, e are listed. See Supplementary Table S5 for the full fold-change dataset

