
Figure 2.
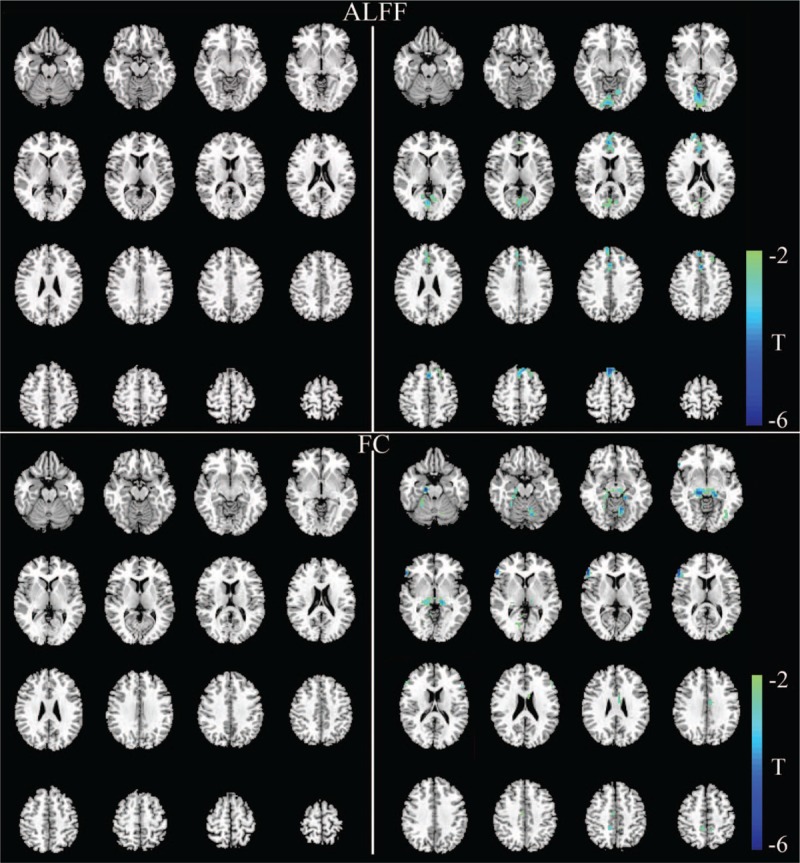
Significant differences in the ALFF values and functional network connectivity between NPC patients and healthy controls. The left part shows abnormal regions in NPC patients before RT compared with healthy controls, and the right part shows abnormal regions in NPC patients after RT compared with healthy controls. There are no significant changes in ALFF values and FC before RT (upper and lower left). After RT, decreased ALFF values were observed in the lingual gyrus, calcarine sulcus, medial prefrontal gyrus, and cingulate cortex (upper right) (P < 0.05, corrected for multiple comparisons with the AlphaSim program). Decreased FC values were observed in multiple cerebellar–cerebral regions, including the cerebellum, parahippocampus, hippocampus, fusiform gyrus, inferior frontal gyrus, inferior occipital gyrus, precuneus, and cingulate cortex (lower right) (P < 0.001, corrected for multiple comparisons with the AlphaSim program). ALFF: Amplitude of low-frequency fluctuation; FC: Functional connectivity; NPC: Nasopharyngeal carcinoma; RT: Radiotherapy.