Figure 2.

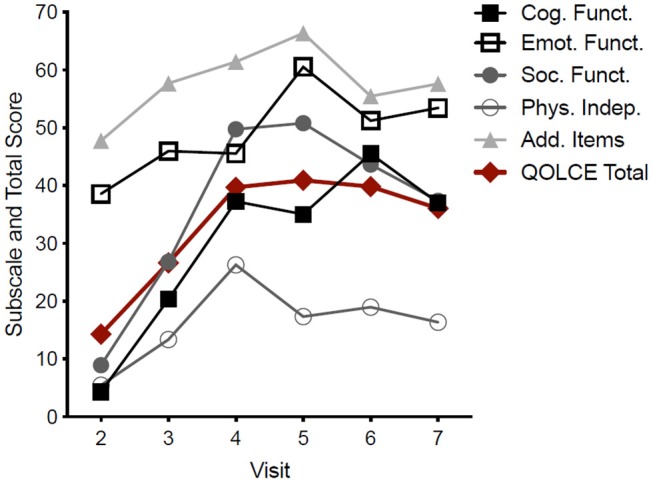
Pooled QOLCE-55 scores and subscores for all seven participants. The values shown at each visit represent the QOLCE-55 total and subscores for the preceding month. Data are mean from seven participants.

Pooled QOLCE-55 scores and subscores for all seven participants. The values shown at each visit represent the QOLCE-55 total and subscores for the preceding month. Data are mean from seven participants.