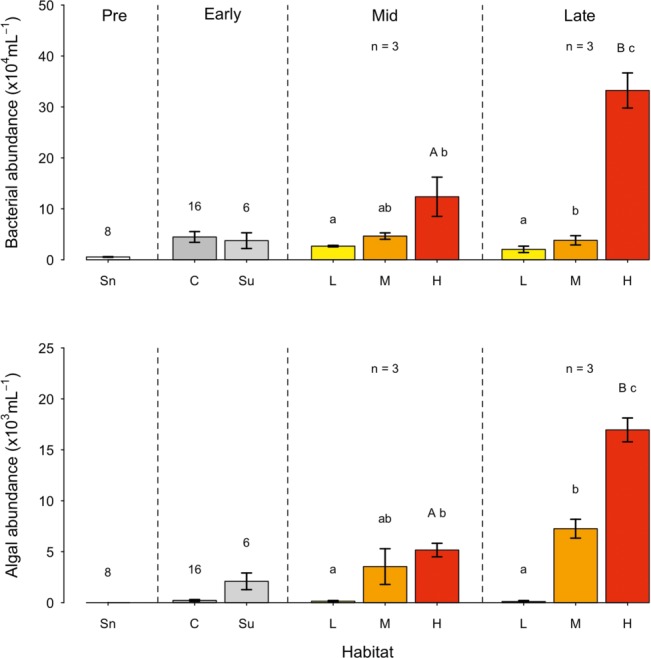
Figure 2.

Bacterial and algal abundance (mean ± SE) across the ablation season (sectioned as Pre: Pre-snowline retreat; early, mid, and late ablation periods) in snow (Sn); Ice cores (C); Surface ice (Su); and surface ice with a low (L), medium (M), and high (H) algal coverage. Numbers above bars represent the n of the sample. Letters above bars represent homogenous groups determined by a one-way ANOVA (abundance ~ algal coverage) and capital letter denote homogenous group determine by a t-test between surface ice with a high algal coverage between mid and late ablation periods.
