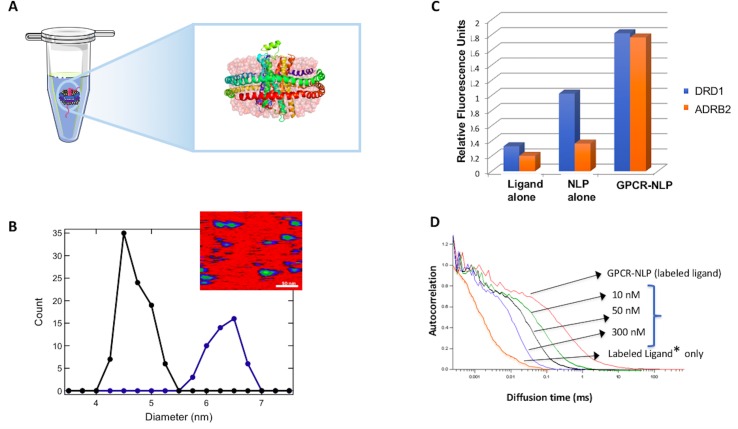
Figure 3.
Cell-free co-expression for production of G-protein-coupled receptor (GPCR)-NLP complexes. (A) Illustrated β2-adrenergic receptor (β2AR) embedded in an NLP via cell-free expression and self-assembly. (B) Atomic force microscopy (AFM) image of NLPs with inserted GPCRs to determine the insertion rate based on the increase in the diameter of the disc. The inset shows an AFM image. The scale bar is 50 nm. (C) A histogram showing ligand binding for cell-free produced dopamine receptor D1 (DRD1) and β2AR (ADRB2). Data is based on fluorescent filter binding. (D) Fluorescence correlation spectroscopy (FCS) analysis of ligand concentration dependent binding is illustrated for the NK1 GPCR. An increase in the ligand concentration shows increased binding based on the shift of the spectrum to the right.

