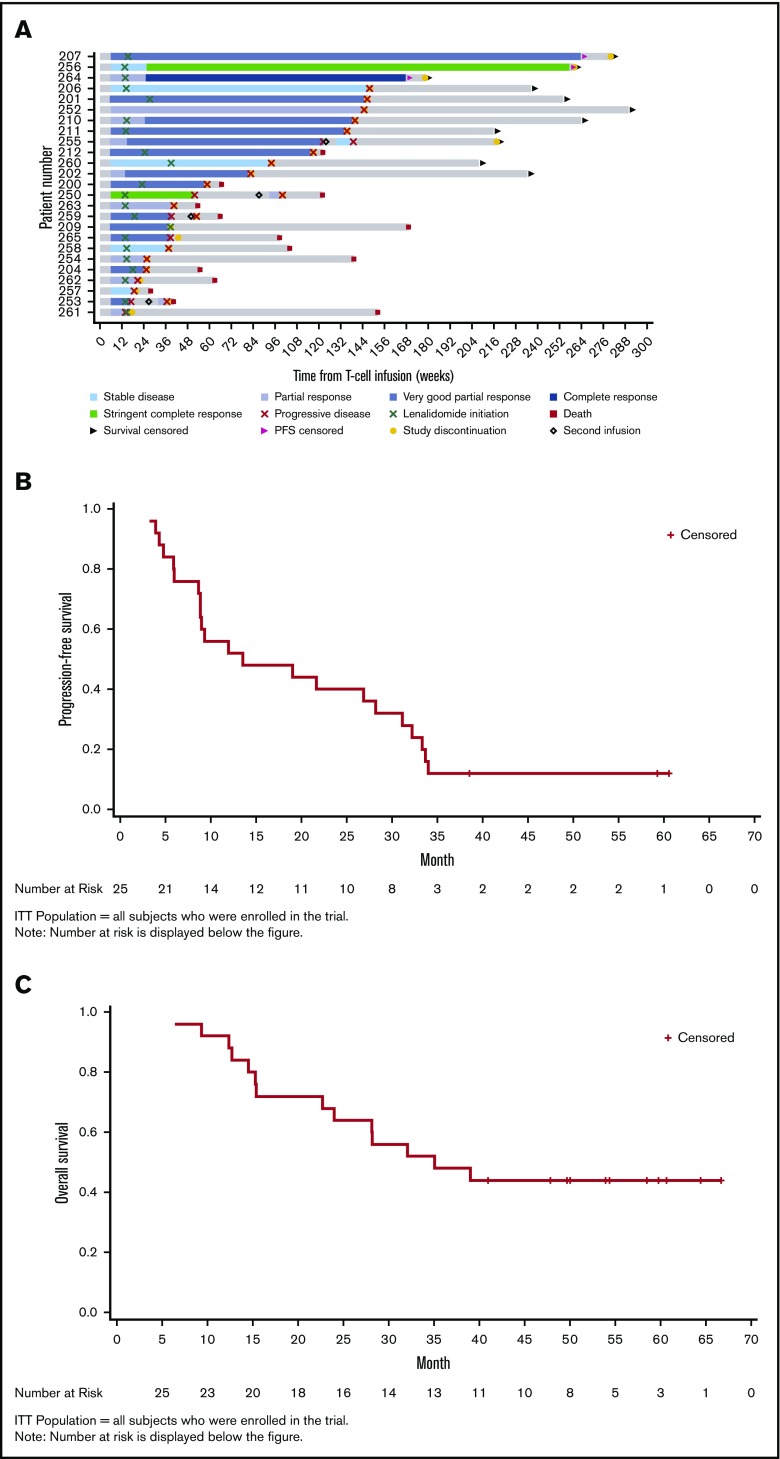
Figure 1.
Clinical responses (ITT population). (A) Patient response profiles. Swimmer plot showing duration of clinical response and survival after disease progression. Patients 207, 256, and 264 were disease progression-free at more than 3 years post-NY-ESO-1c259 T-cell therapy. Day 0, ASCT; day 2, NY-ESO-1c259 T-cell infusion. (B) PFS, Kaplan-Meier plot. Surviving (censored) patients are represented by tick marks. (C) OS, Kaplan-Meier plot. Surviving (censored) patients are represented by tick marks.

