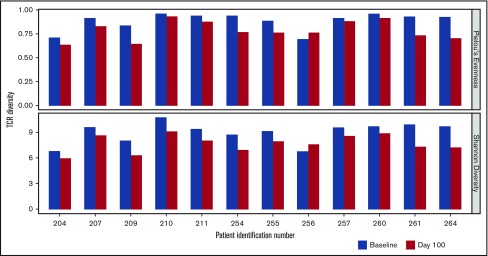
Figure 5.
TCR clonality of T-cell response postinfusion. TCR clonality was assessed via Pielou’s Evenness Index (upper) and Shannon’s Diversity Index (lower). These indices were calculated using all TCR sequences evaluated for preinfusion manufactured product and the corresponding BM samples taken at day 100 postinfusion, and are shown for all patients in whom both baseline and day 100 samples were collected. Day 100 samples were not available for 2 patients, for whom the sample collected at the point closest to day 100 was analyzed.

