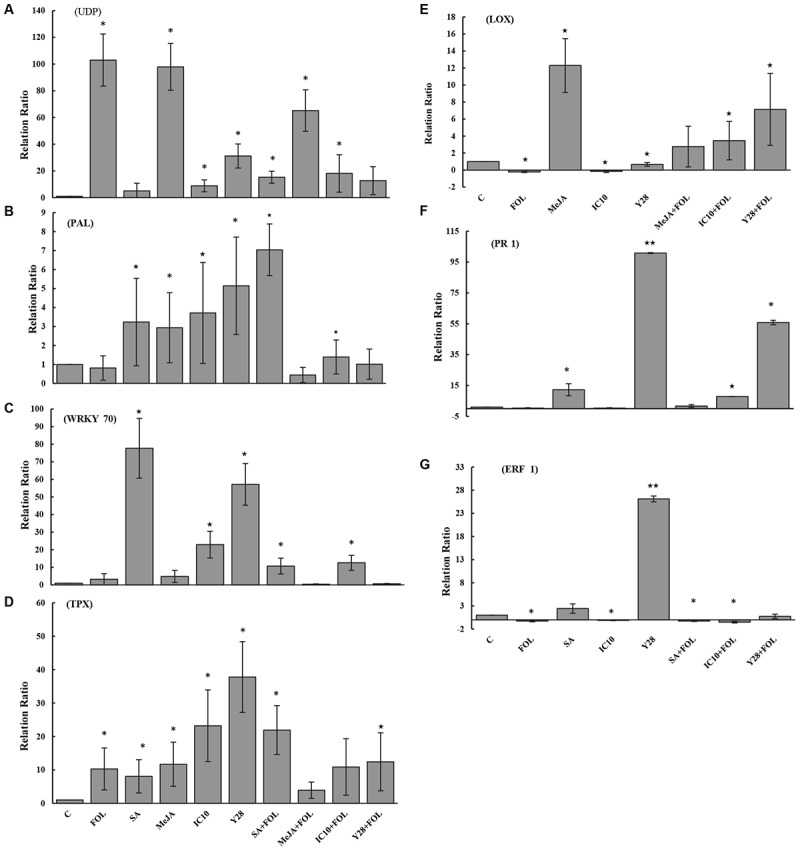
FIGURE 6.

The relative level of gene expression (fold) determined by qRT-PCR of seven target genes including UDP (A), PAL (B), WRKY70 (C), TPX (D), LOX (E), PR1 (F), and ERF1 (G) versus reference control (Tubulin gene) in tomato “Riogrande” treated with chemical (MeJA and SA) or biological agents (S. enissocaesilis strain IC10 and S. rochei strain Y28) 48 h after inoculation with FOL/ distilled water. Untreated and non-inoculated plants were considered as control (C) and as reference sample. Standard error represents for three biological replicates. Positive values of fold change indicate up-regulation while negative values indicate down-regulation. The values marked with one and two asterisk are significantly different from control at P < 0.05 and P < 0.01, respectively.
