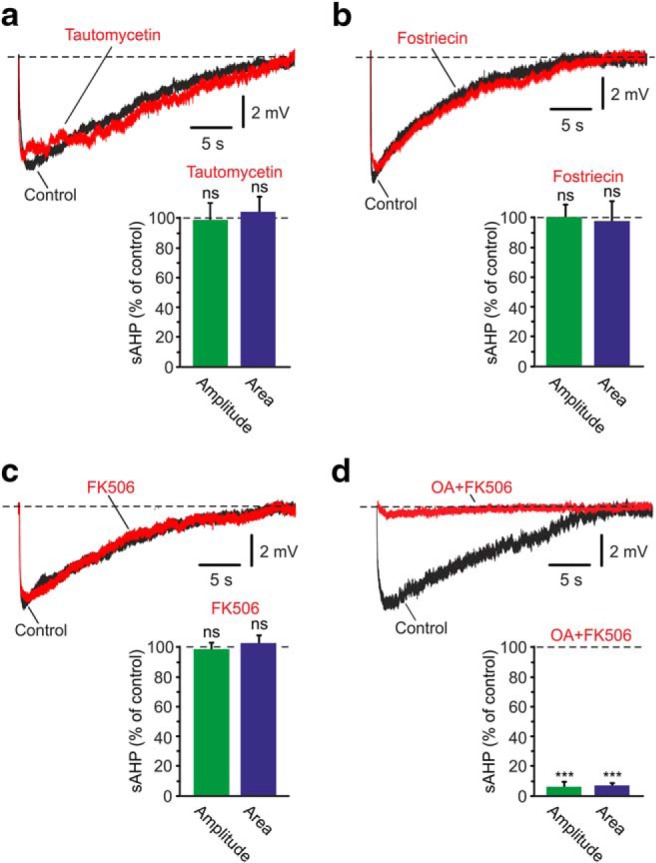
Figure 4.

Effects of PP inhibitors on the NKA-sAHPs. a, Inhibition of PP-1. The two overlaid traces represent the control NKA-sAHPs in the same neuron before (Control; black) and after perfusing the slice with the PP-1 inhibitor tautomycetin (25 nm; red). Bar diagrams represent the normalized results of seven experiments (mean ± SEM) for NKA-sAHP amplitudes (green) and areas (blue). b, Inhibition of PP-2A. Same as in a, but applying the PP-2A inhibitor fostriecin (50 nm; n = 6). c, Inhibition of PP-2B. Same as in a, but applying the PP-2B inhibitor FK506 (10 μm; n = 5). d, Simultaneous PP-1, PP-2A, and PP-2B inhibition. Same as in a, but applying together the PP-1 and PP-2A inhibitor OA (1 μm; red) and FK506 (n = 6). Inhibiting either one of the three PPs alone had no effect on the NKA-sAHPs. Inhibiting all three together strongly suppressed the NKA-sAHPs, indicating that at least two of the PPs can each independently dephosphorylate the NKAs. ***p < 0.001, ns, not significant.
