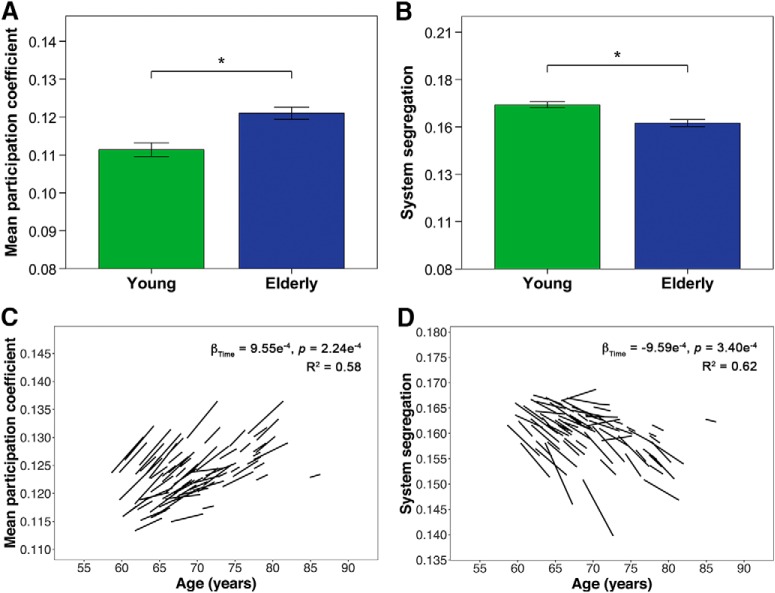
Figure 4.
Healthy elderly show cross-sectional and longitudinal changes in mean participation coefficient and system segregation. A, B, Bar charts indicate mean (±2 SE) participation coefficient and system segregation of young and elderly participants at baseline. *indicates a statistically significant difference (p < 0.05) between young and elderly participants at baseline. C, D, Spaghetti plots indicate model-fitted longitudinal changes in mean participation coefficient and system segregation for each individual. Results displayed are thresholded at p < 0.05. Healthy elderly showed higher mean participation coefficient across all nodes and lower global system segregation compared with young participants as well as with time.

