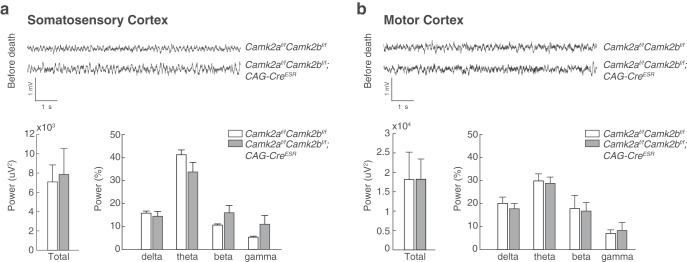
Figure 4.
Power spectra analysis reveal no changes in brain activity upon deletion of both CAMK2A and CAMK2B. a, Example traces of LFP recordings obtained from somatosensory cortex of Camk2af/f;Camk2bf/f control mice (top trace; n = 8) and Camk2af/f;Camk2bf/f;CAG-CreESR (bottom trace; n = 5) during the last day of recording (35 d after onset of gene deletion). Bar graphs depict calculated total power across the last 3 d of recording (bottom left) and percentage of relative power normalized against the total power across four different frequency bands: delta (2–4 Hz), theta (5–10 Hz), beta (13–30 Hz), and gamma (30–50 Hz) (bottom right). b, Example traces of LFP recordings obtained from motor cortex of Camk2af/f;Camk2bf/f control mice (top trace; n = 8) and Camk2af/f;Camk2bf/f;CAG-CreESR (bottom trace; n = 5) during the last day of recording (35 d after gene deletion). Bar graphs depict averaged total power across the last 3 d of recording (bottom left) and percentage of relative power normalized against the total power across four different frequency bands: delta (2–4 Hz), theta (5–10 Hz), beta (13–30 Hz), and gamma (30–50 Hz) (bottom right). No differences were observed in the days preceding death in either total power or specific frequency bands. Error bars depict the SEM.

