Figure 6.
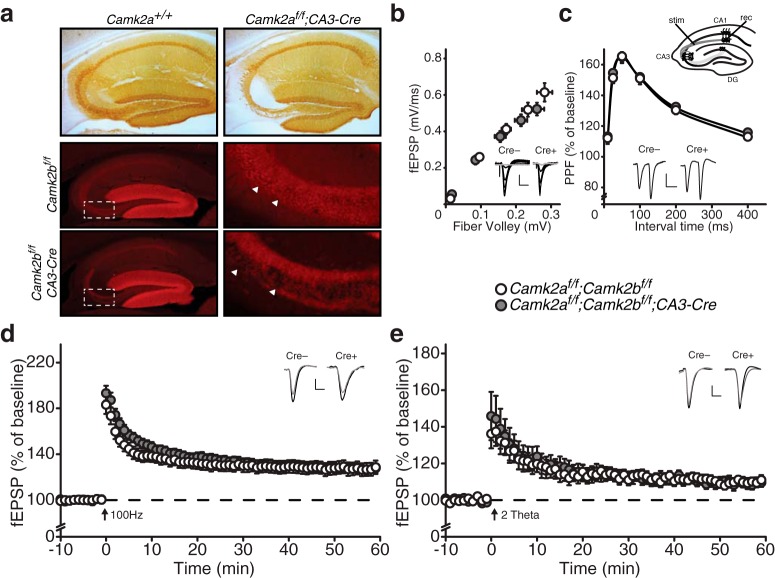
Presynaptic CAMK2A and CAMK2B are not necessary for CA3–CA1 LTP. a, Specific deletion of CAMK2A (Top) and CAMK2B (middle and bottom) in the CA3 area of the hippocampus. Immunohistochemical stainings showing deletion of CAMK2A in the CA3 area in Camk2af/f;CA3-Cre mice (top right). Note the absence of CAMK2A staining in all layers of the CA3 area except for mossy fibers coming from the dentate gyrus that still express CAMK2A. Immunofluorescent images showing deletion of CAMK2B in the CA3 area in Camk2bf/f;CA3-Cre mice (bottom right). Note that interneurons, oligodendrocytes, and mossy fibers coming from the dentate gyrus still express CAMK2B. The middle and bottom right pictures are enlarged images of boxed areas. Arrowheads show CA3 pyramidal cell somas in Camk2bf/f mice (middle right) and absence of fluorescence in cell somas in Camk2bf/f;CA3-Cre mice (bottom right). b, Camk2af/f;Camk2bf/f;CA3-Cre mice [fiber volley: (n = 19 from 6 mice), fEPSP slope: (n = 19 from 6 mice)] show normal basal synaptic transmission compared with Camk2af/f;Camk2bf/f mice [fiber volley: (n = 22 from 6 mice), fEPSP slope: (n = 22 from 6 mice)]. c, Inset, Schematic overview of LTP induction in the CA3–CA1 pathway (see Materials and Methods). stim, Stimulating electrode; rec, recording electrode; DG, dentate gyrus. Camk2af/f;Camk2bf/f;CA3-Cre mice (n = 41 from 6 mice) show normal PPF compared with Camk2af/f;Camk2bf/f mice (n = 44 from 6 mice). d, Camk2af/f;Camk2bf/f;CA3-Cre mice (n = 20 from 6 mice) show normal 100 Hz LTP compared with Camk2af/f;Camk2bf/f mice (n = 14 from 6 mice). e, Camk2af/f;Camk2bf/f;CA3-Cre mice (n = 9 from 4 mice) show normal theta burst LTP compared with Camk2af/f;Camk2bf/f mice (n = 10 from 4 mice). Error bars indicate SEM. Electrophysiological example traces can be found within the figures. Scale bars: y, 0.2 mV; x, 10 ms.

