Figure 6.
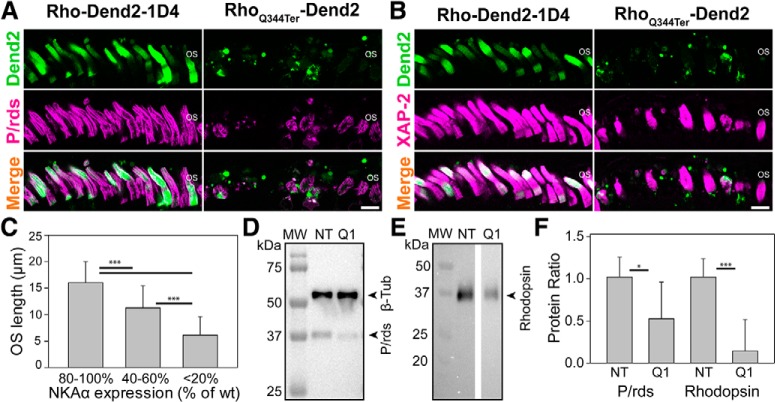
Rods expressing RhoQ344ter-Dend2 exhibit disorganized rod OSs. Immunofluorescence labeling of OSs using (A) anti-P/rds (magenta) and (B) XAP-2 (magenta) antibodies. Retina sections (21 DPF) expressing either Rho-Dend2-1D4 (green) or RhoQ344ter-Dend2 (green) were labeled. C, Rods with lower NKAα expression demonstrate shorter OSs. NKAα expression levels in RhoQ344ter-Dend2-positive rods (21 DPF) were normalized to average NKAα level (100%) in nontransgenic wild-type (wt) rods (21 DPF). Rods with three different ranges of NKA expression levels (80–100, 40–60, and 0–20%) were analyzed. D, Representative immunoblot comparing 21 DPF retina samples of either NT or Q1 animals. Primary antibodies against β-tubulin and P/rds were used in combination with anti-mouse HRP for chemiluminescence detection of the signals. E, Representative blot comparing 21 DPF retina samples of either NT or Q1 retinas. Primary antibody against rhodopsin (B6–30) was used in combination with anti-mouse HRP for chemiluminescence detection of the signals originating from endogenous Xenopus rhodopsin. Molecular weight (MW) marker is in kilodaltons for both D and E. F, Quantification of immunopositive signals in D and E. NT average value was standardized to 1.00 for both P/rds (normalized to β-tubulin) and total endogenous rhodopsin, for readily comparison with groups expressing RhoQ344ter-Dend2 (Q1). For immunoblot against P/rds, the relative values were 1.00 ± 0.23 for NT and 0.52 ± 0.42 for Q1 (based on n = 6 animals; p = 0.025). For immunoblot against total endogenous rhodopsin, the relative values were 1.00 ± 0.21 for NT and 0.14 ± 0.37 for Q1 (based on n = 6 animals; p < 0.001). Scale bars, 10 μm. *p < 0.05, ***p < 0.001.

